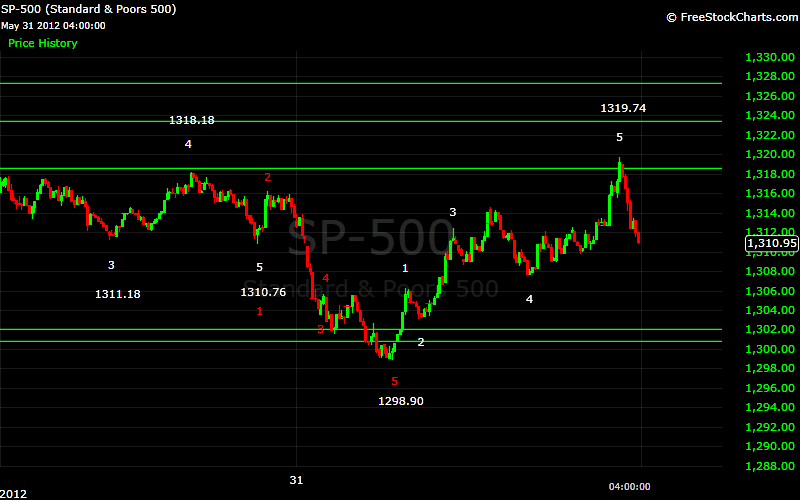
The market started off the day to the down side once again, selling off rather sharply, until it reached near 1302. After a small move up, the SPX continued the move down until reaching 1298.90. At that point a 5 wave sequence from 1335 was completed, and the market quickly rallied off that low. After an initial move to 1306, the SPX made it up to 1312 before it encountered any real resistance. Here the market spent some time consolidating, forming a semi-inverted corrective wave 4, before one final rally to 1319.74.

Once again, the rally from the morning sell-off was encouraging for the bulls, as the SPX moved into positive ground near the end of the day. However, once there, as has been the case lately, the market could not hold its gains into the close. The market sold off rather sharply, carrying the market into negative territory at the close. These sell-offs into the close have generally been a pre-cursor for a down move the following day.
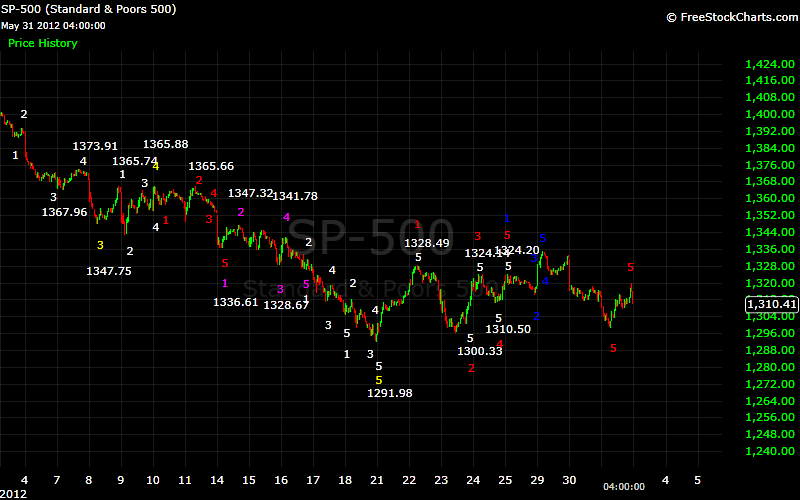
It is still difficult to say which way this market will eventually breakout. The market is still in a trading range, waiting for some impetus to move it one way or another. Should we break above today’s 1320 high, and assuming the move from 1299 to 1320 was wave 1 of a larger move higher, we have two initial targets from wave 3. The first would be at 1324. Should wave 3 end there, it would suggest more choppiness ahead, with only slightly higher highs. The second target for wave 3 would be 1344. A move to this level would indicate the start of the rally everyone has been waiting for. On a larger scale, if 1292 to 1335 was wave 1, wave 3 would project to either 1335, or 1338. This would suggest that the first scenario we outlined is more likely.
To the downside, using 1335 to 1299 as a wave 1, wave 3 projects to 1298, or 1293. This suggests that we would be able to complete a 5 wave sequence without falling below the 1292 low, making a continuation of this trading range possible. The key level to the downside is the 1291.98 low. If the market takes that out, we could be headed to 1250 initially, and possibly the low 1200’s.
It may be that we will stay in this trading range, but the longer we stay in it the less likely it seems that we will break out to the upside. Only a break either above 1340-1344, or below 1292, will signal a breakout from this range.
Short term, look for 1324, 1335, and 1338 to offer resistance, while there seems to be a lot of support clustered between 1298 and 1305, and at 1293.