The SPX gapped down at the open this morning
dropping to within .12 of yesterday’s low at 2040.49. The index reversed at
that point, closing the opening gap as it rose to 2048.57. After a small
pullback the rally continued as the SPX reached 2051.91, and then 2053.84. Once
the SPX reached that level, it began to pull back again, first falling to
2050.37, and then 2049.35 before staging another small rally into the close.
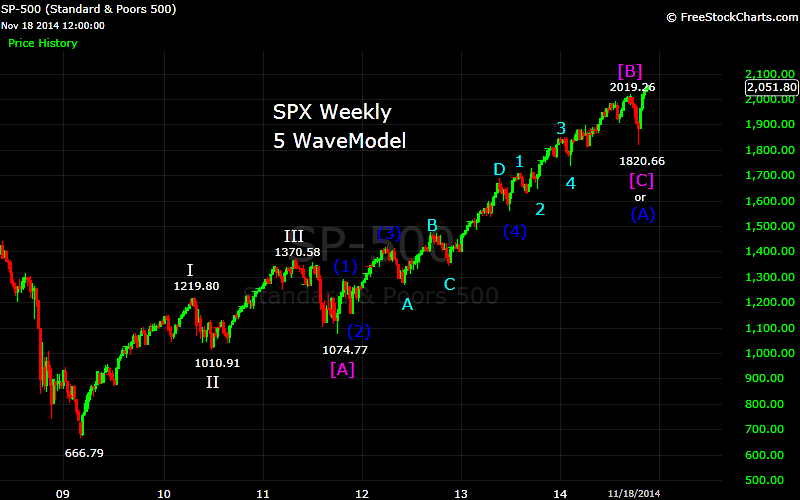
As noted previously, the SPX completed a 5 wave
sequence from 2001.01 at 2056.08. This completed Wave 3 of a 5 wave sequence
from the 1820.66 low, with Wave 4 then completing at 2040.37. From that low the
SPX completed a 5 wave sequence at 2052.14 for a wave 1, which was then
followed by an inverted corrective wave 2 that completed today at 2049.35.
With what appears to be 4 waves now completed from
the 1820.66 low, a target for wave 5 of the sequence can now be calculated. This
target is between 2072 and 2126. This is a large range at the moment, but near
the 2070 target area mentioned here for awhile. As the current wave unfolds a
more accurate range should be able to be determined.