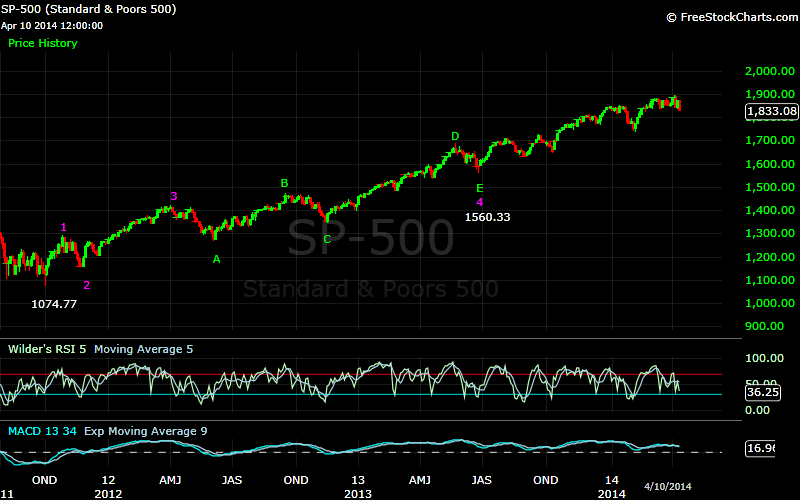
For some time now I have been tracking a 5 wave
sequence from the June 24th low of 1560.33 on the SPX. I have been
looking for the end of this sequence to complete a larger 5 wave sequence from
the October 4th 2011 low of 1074.77. The sequence from 1560.33 began
with Wave 1 to 1709.36, and was followed by an inverted corrective Wave 2 which
completed at 1646.47. After that the SPX completed a 5 wave sequence higher to
1850.84, which I had originally counted as Wave 3 from 1560.33. This was
followed by a sequence lower to 1737.92. Another sequence completed to the
upside at 1882.35. From this point the SPX became quite choppy, and by my count
3 waves into the 1814.36 low as 1837.49-1872.53-1814.36. These 5 waves from the
1850.84 high, 1737.92-1882.35-1837.49-1872.53-1814.36, count as an inverted
corrective wave. Since Wave 2 from 1560.33 was an inverted corrective wave and
normally only one corrective wave in a sequence is complex as Wave 2 was, it is
best to count 1850.84 as Wave 1 of 3 from 1560.33, and the subsequent inverted
corrective wave as Wave 2 of 3.

This count suggests that the SPX should form 3
waves higher from 1814.36 to complete Wave 3 from 1560.33. This would then be
followed by a corrective Wave 4, and then one final move higher to complete the
sequence from 1560.33, and also a sequence from 1074.77. Looking at the
relationship between Wave 1, and Wave 3 so far, Wave 5 would be expected to be
longer than Wave 3, indicating that the SPX would move much higher than current
levels.
So again, I am looking for 3 waves higher from
1814.36 to complete this Wave 3. Looking at the action from that low, 3 waves
can be counted as 1884.89-1850.61-1888.59, which was today’s high. The count of
1850.84-1814.36-1884.89-1850.61-1888.59 satisfies the parameters for a
completed sequence from 1814.36. A move below 1850.61 would most likely confirm
this count, and signal the end of Wave 3 from 1560.33. It is also possible at
the moment that the 1884.89-1850.61-1888.59 move is only the first 3 waves of
Wave 3 of 3 of 5. A move above 1888.59, without violating the 1850.61 low,
would increase the likelihood of this scenario.
As I mentioned above, this would require one more
move higher for the SPX, a move that should exceed the 242 point length of Wave
3. I am still not completely sold on the idea of another 250 +/- move on the
SPX, and there is another count that suggests that today may have marked the
completion of a larger degree wave. This count would indicate that the SPX may
be near, or may even have completed, the sequence from 1074.77.

This is a count I spoke of back in October (http://5wavemodel.blogspot.com/2013/10/mondays-market-10142013.html).
Whereas the count above counts the first three waves from 1074.77 as Wave 1(1292.66),
Wave 2(1158.66), Wave 3(1422.38), followed by an inverted corrective Wave 4
which completed at 1560.33, this alternate count is slightly different. This
has 1292.66 as Wave 1, 1158.66 as Wave A of 2, and 1422.38 as Wave 1 of B of 2.
The next 5 waves are the same in each case, with
1266.74-1474.51-1343.35-1687.18-1560.33 completing an inverted corrective wave,
only of differing degrees. In this alternate count, this is Wave 2 of B of 2.
Waves 3, 4, and 5 completed as 1709.67-1627.47-1729.86, and completed Wave B of
2. 1646.47-1850.84-1814.36 then completed Waves C, D, and E, and Wave 2 from
1074.77. Just as in the first scenario the SPX now needs to complete 3 waves
higher from 1814.36, but this time those three waves will complete a sequence
from 1074.77.
The three waves I outlined in the first example,
1884.89-1850.61-1888.59, also satisfy the parameters for the completion of this
wave. The same caveats apply to this scenario as they do in the first.
The only difference between these two scenarios is
the move from 1709.36 to 1627.47 following the initial rise from 1560.33. I had
originally counted this as a single 5 wave sequence, and later changed it to
three separate waves, 1639.43-1669.51-1627.47. This move was quite choppy,
which made it difficult to track with complete certainty. If my original count
was correct, and it was a single move, the alternate scenario of this being the
completion of the wave from 1074.77 is the most probable. If it is three waves,
the first scenario is the most probable. In either case, I would expect a move
lower to begin soon, with the main difference being the degree of that move
lower.