Wednesday, July 3, 2013

Wednesday's Market 07/03/2013

The action of the SPX seemingly played out much as I had outlined yesterday, but looks can sometimes be deceiving. The index opened lower as expected, gapping down at the open and dropping straight to 1604.57, right at the 1605 support level. The SPX then rallied to 1610, before dropping back near the morning’s low, but holding just above it. The SPX rose again, this time to 1610.53, and then after some choppy trading rallied in earnest, moving up to 1613, and then 1618.97. From there the index started to drop, falling back to 1614.82 before rising slightly into the close.


Since I was looking for a lower open, with support at 1605, followed by a rally to 1631, today’s shortened action seemed to fit the bill. The only troublesome aspect was the drop to 1604.57 appears to have been a singular move. I had been expecting a 3-4-5 decline to 1605 to complete the sequence from 1626.61. While it is possible that the move was so swift that those last waves occurred beyond the resolution of my chart, but that is an exceedingly rare event. It is more probable that I have misread several waves, and this wave structure is slightly different than I had thought.

This thesis seems to have been confirmed by the action following today’s low. From that low, the SPX completed a 5 Wave sequence at 1613.23, and then after a small pullback, another sequence to 1618.97. From yesterday’s 1616.77 low, we then have 1615.1-1604.57-1613.23-1611.88-1618.97. This happens to complete a semi-inverted corrective wave.


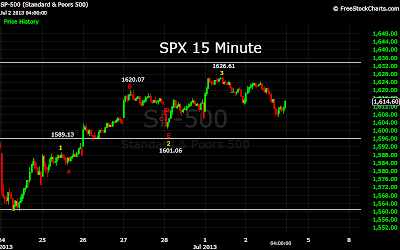
1618.97 would then seem to be the fourth wave from 1626.61, with the fifth wave likely carrying below 1601. I will try to explain the changes in my count in more detail tomorrow, but for now it will suffice to say that it is most likely that 1626.61 marked the end of a 5 wave sequence from 1560.33. So far four waves of a correction from that high have completed, with the fifth wave likely to find support at 1593. At this point I would consider that the end of the corrective phase, and do not foresee a re-test of the 1560 low.

Thank you.

Tuesday, July 2, 2013

Tuesday's Market 07/02/2013

I mentioned yesterday that today’s first move would most likely be to the downside. That turned out to be the case, as the SPX gapped down at the open, pulling back to 1613.07, but remaining above yesterday afternoon’s 1612.85 low. After that lower open, the index moved higher, fairly steeply at first, climbing to 1621.98 within the first half hour, at which point the trading turned choppier as the SPX churned its way up to 1624.26. This was reminiscent of yesterday’s open, with a steep climb leading to a choppy high. As was the case yesterday, the choppy trading led to a short term top, followed by a sharp decline. Unlike yesterday, however, today’s decline dropped below the previous close, and then continued down to 1606.77. After reaching that level, the SPX tried to recover, moving back up to first 1612.65, and then 1615.01 near the close after a small pullback.


From yesterday afternoon’s 1612.85 low, the SPX completed the first wave of a sequence at 1616.11. This morning’s lower opening then became the first wave of an inverted corrective wave. This inverted correction completed at 1620.39, and was followed by the completion of the sequence from 1612.85 at 1624.26. The first wave of the subsequent decline ended at 1618.07, which was again followed by an inverted second wave, which terminated at 1610.15. The 5 wave decline from 1624.26 then terminated at 1606.77, close to the 1605 support level I spoke of yesterday. From that point, the SPX completed 3 waves higher to 1615.01.


Looking at the entire wave structure from the 1626.61 high, it appears that yesterday afternoon’s decline to 1612.85 was the first wave in a 5 wave sequence to the downside. This morning’s climb to 1624.26 was likely the first wave of an inverted corrective sequence. The decline to 1606.77 was the second wave, with the three waves higher into the close completing the inverted corrective sequence. It is now likely that the SPX will move lower to complete the sequence from 1626.61. I would still characterize this as the fourth wave of a sequence from 1560.33.

I am looking for a lower open to the day tomorrow. I would still expect this wave to end near the 1605 support level. If the index falls below 1601.06, I would need to re-evaluate my count. Up to this point nothing has occurred to alter my view of this being the fourth wave from 1560.33. Wave 1 completed at 1589.13, with an inverted corrective wave 2 completing at 1601.06. Wave 3 then completed at 1626.61. Wave 4 should finish near 1605, and be followed by wave 5 to 1631. Keep in mind that this will in turn be the first wave of a higher degree wave, and second waves are often inverted corrective waves. This could mean a shallow correction, followed by a swift move higher. But I do not want to get too far ahead of myself. For now, the level to watch is 1601.06. Unless that level is broken, I look for a move higher to 1631.

Thank you.

Monday, July 1, 2013

Monday's Market 07/01/2013

I stated in Friday’s post that it appeared the SPX had completed a semi-inverted corrective wave at 1606.24, and that the index was poised to make a swift run up to 1631. The SPX gapped up this morning, and reached 1619.32 before pulling back. That pullback was brief, with the SPX only dropping to 1617.19 before moving higher. The index rose to 1626.18, and then pulled back to 1622.37. From there the SPX chopped its way to a new intra-day high at 1626.61. After that the action was predominately to the downside. First the SPX dropped to 1622.86, and then traded sideways before falling further to 1617.18. Then, after bouncing above 1621, the index dropped to 1612.85 before rising slightly into the close.


I also mentioned on Friday that appeared that the completion of the wave from 1601.06 would be only wave 3 from the 1560.33 low, and that this wave may complete as 1621-1619-1631. Today’s initial move to 1619 was slightly below the 1621 projection, but appears to be Wave 3 1601.06. Wave 4 was the small pullback to 1617.19, and the move to 1626.61 completed the sequence.

After that the index completed a 5 Wave sequence to the downside that completed at 1615.27, followed by a higher degree sequence that completed at 1612.85. This is close to the first support of 1611. This could be the completion of Wave 4 from 1560, with the Wave 5 target still at that 1631 level.

There is some indication that Tuesday’s first move may be to the downside, and if it is, the next support is at 1605. I would fully expect this pullback to hold above the 1601.06 low. Where ever this current Wave 4 ends, it appears the target is still near 1631.

Thank you.