Saturday, July 28, 2012

Friday's Market 07/27/12

Yesterday I said I would be looking for a higher opening, to 1366-1367, a pullback to perhaps 1359, and then on towards 1393. The market did open higher, reaching 1367.85 at the open, and then continuing on to 1368.86 before experiencing a minor pullback. After that, it was almost straight up the rest of the day. By midday, the market had risen to 1377.41, and then spiked up to 1388. After a small pullback, the market reached the day’s high at 1389.19, and then dipped to 1384.49 before the close. This was within the cluster of resistance at 1387-1397 that I spoke of yesterday.

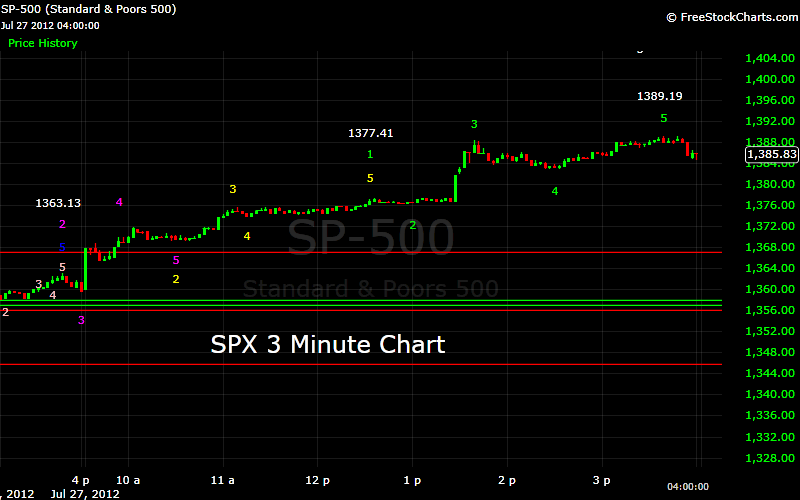
The market has been forming a nested wave sequence from the 1329.24 wave 4 low, and that sequence completed today at 1377.41.Then, with that being a wave 1 from 1329, the market completed another 5 wave sequence at 1389.19.


I have been targeting 1393 as the termination point of wave 3 from 1267. Today the market moved within our target range for that termination point. 1389 completed a 5 wave sequence from 1329, and is within my model’s range for wave 5 from 1309, and wave 3 from 1267. It is possible that the market may work slightly higher, creating smaller and smaller waves, but I think this is the end of the sequence.

If this is the end of wave 5, there are three scenarios. My targets for wave 5 from 1267 have been either 1426, or 1497. If the corrective wave 4 terminates between current levels, and about 1368, 1497 would be my target. If the correction carries further, to between 1350, and 1330, 1426 would be the likely target. There is also the possibility that this was the end of wave 5 from 1267.

I will address this in more detail over the weekend.

Friday, July 27, 2012

Thursday's Market 07/26/12

As I anticipated, the market moved higher at the open, surpassing my target of 1356. After a gap open, the market continued past the 1357-1358 resistance level, and rose to 1361.51. That level did not hold, however, and the SPX dipped to 1351.48. After that the rally continued, with the market first reaching 1359.10, and then to a new intra-day high at 1363.13. From there, the market moved slightly lower into the close.

The move today continued the rally from Tuesday’s 1329.24 low, in what I consider to be wave 3 of 5 from 1267. This wave should terminate at, or near, 1395-1397.
Short term support is at 1357-1358, 1323-1326, and 1313-1315. Resistance is at 1367, and then 1387-1397.
Very short term, it appears the market is forming a complex wave structure from the 1329 low. I look for a move higher on Friday, with a target of 1366-1367, followed by a pullback to perhaps 1359. This should set the market up for a move to my 1393 wave 3 target.

Wednesday, July 25, 2012

Wednesday's Market 07/25/12

The market fell slightly to the downside near the open, and then continued the late afternoon rally from yesterday, moving up to 1343.98. This completed a 5 wave sequence from the 1329.24 low, and from there the market moved pretty quickly to the downside. By late morning the SPX hit 1331.50, and then attempted another rally. That rally fell just short of the morning’s high, from which point the market fell back to 1335.87 before rising slightly into the close.

As I mentioned above, the market completed a 5 wave sequence at 1343.98. One of the support lines generated by the sub-waves of that sequence was at 1331.2. The subsequent drop from 1343.98 ended at 1331.50. This completed a 5 wave sequence, as did the move higher from that point to 1343.77. Another support line generated by the move from 1329 to 1344 sits at 1336.2, with the move down from 1343.77 terminating at 1335.87. This also completed a 5 wave sequence.
It still appears that the market put in wave 4 of 3 from 1267 at 1329.24. The target for wave 5 remains around 1395. If the market moves below 1329, it seems most likely that the market completed a 5 wave sequence from 1267 at 1380.39.

Today’s late afternoon low of 1335.87 appears to be the completion of a 5 wave sequence. If the 1329.24 low was wave 4 of 3, the market should move higher from this point, with a near term target of 1346, or 1356. Resistance is at 1338, 1341, and 1356.
If the market moves lower, there is a cluster of support from this level, to 1331, which marks the lowest support level generated by the wave from 1329 to 1344. If the market breaks below that, support is at 1323-1326, and 1313-1315. In my mind a fall below 1329.24 low probably means a 5 wave sequence from 1267 has been completed.