While this was a holiday shortened week, it certainly was not short on action. The week started off on a good note, with the SPX rising to 1335. The market drifted down from its high on Tuesday, then gapped down at the open on Wednesday. The selling continued into Thursday, where the market fell below 1300 to 1299, before rallying into the end of the day. Another gap down on Friday put the market below 1300 once again, but this time there was no rally. The market continued lower throughout the day, bottoming at 1277.25.

I think the market finds itself at a very critical juncture. This breakout to the downside could indicate much lower prices ahead, or it could be the capitulation selling needed before the oversold rally almost everyone has been waiting for, but thus far has failed to materialize. I will start with the larger picture this week, and try to outline what may unfold next.
As I have been saying since my very first post, I believe the move from 667 to 1422 was a complete 5 wave sequence. This sequence was 666.79, 1219.80, 1010.91, 1370.58, 1074.77, and 1422.38. From this sequence, several support levels can be calculated. These are usually the most likely places for the termination of the ensuing corrective wave. Two of these levels are of interest at the moment, 1258, and 1195. These price levels on many different wave scales and at the moment seem to be the two most likely ending points.


The daily chart shows the 5 wave sequence from 1074.77, and once again the support levels indicated by that sequence. The levels of interest in this case are 1267, and 1170, very close to the levels generated by the 667-1422 wave sequence. It is also important to note that some of the other levels generated have already marked important levels from 1422.


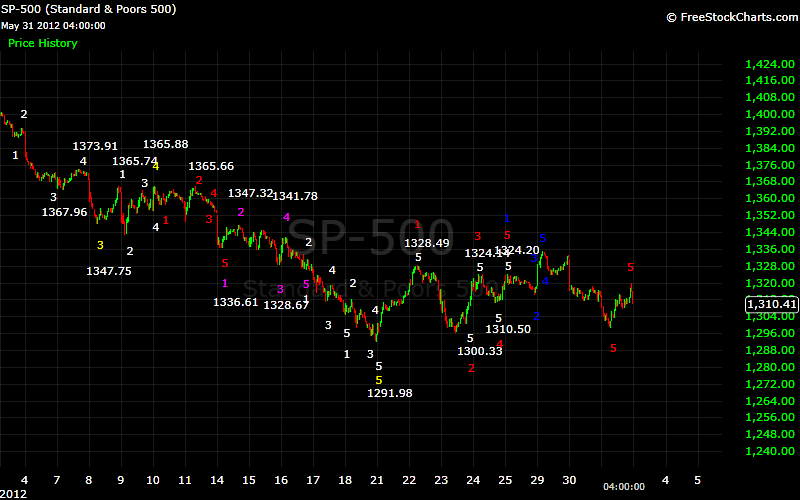
From 1422, the market has already formed one 5 wave sequence, and has started another. The first sequence was 1357.38-1415.32-1347.75-1365.88-1291.98. With the support/resistance levels generated by this sequence added to the chart, it is easy to see why the 1324-1325 was such an important level. Once the market fell below 1292, another sequence was underway. The 1422-1292 sequence can also generate likely stopping points for the following sequence of the trend. One of the levels generated by this wave is 1268, again very close to the level we have already mentioned. The other points of interest are 1250 and 1226. This is where it starts getting interesting. The 1268 level would indicate the completion of a 5 wave sequence from 1422. In other words this gives the possible termination point of a 5 wave sequence in which 1292 is wave 1. This sequence would thus be 1422-1292-1335-x-x-1268. The other two levels would indicate the possible termination point of wave 3 of the sequence from 1422. This would mean 1422-1292-1335-1250 or 1226-x-x. The 1268 level points to the possibility that the market may be at the end of the corrective phase, while the 1250 and 1226 levels would indicate the market is still heading lower, possibly to the 1170-1195 level indicated by the next support level.

The next sequence to consider is the 5 wave sequence the market completed this week from 1334.93. Likely stopping points for the next 5 wave sequence generated by this wave are 1271, and 1264. Once again this 1265 to 1270 level appears.
These support/resistance levels, and next wave projections are secondary indicators, if you will, generated by the 5 wave model. While these offer several possible levels, the primary indicator of the model only occurs at termination points. Given the sequence from 1422 already completed, the 5 wave model would generate a termination signal at 1268. This, coupled with the case presented here, seem to offer compelling evidence that this corrective sequence may soon be over. Before I o any further, I will caution that this does not mean we ARE at a termination point. Only that one is possible soon.
The last thing to consider does not concern the SPX, but the DJIA. While I don’t follow this as closely as the SPX, the DJIA chart has another very interesting characteristic. This index seems to be forming a semi-inverted corrective wave. It is in the range that satisfies the 5 wave model for this type of wave, with the lower limit being near 11970, very close to where the index is now. Once again this would seem to indicate a possible end to this corrective phase.

At the moment I see two scenarios. Should the SPX move down to the 1265-1270 level, and the move above the wave 4 high, which we are currently in from 1277.25, a 5 wave sequence from 1422 would be completed, and the market could experience an extended rally. I am not ready to say the market will move to new highs, as this may turn out to be yet a wave 1 of another move down. If the market moves below that level, to 1250, I see the market headed towards the next support level at 1175-1190. Shorter term I am looking at 1283 as resistance. A move above that could mean a short term rally, perhaps back to the 1307 support level. As long as that rally stays below 1312, the 1265-1270 wave 5 termination point scenario remains in play.
If you find any of this information helpful, please visit one of our sponsors, Thank you.