Thursday, May 17, 2012

Wednesday's Market 05/16/2012

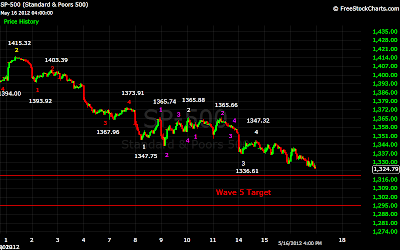
Yesterday we discussed a possible count that would make 1328 the completion of a 5 wave sequence from 1347, and wave 1 of a larger sequence from that point. We suggested that if the bounce off that low to 1334 were wave 2, we could expect the ensuing waves 3, 4, and 5 to play out something like 1317.40-1325.20-1311, with 1311 being our optimal target from the 1415 high.

1334 turned out not to be the end of wave 2, with the market rallying at the open to 1341.78, and in the process moving above 1340.54, confirming the possible count from yesterday. Despite what looked again like a pretty impressive rally, the market quickly reversed course, and headed to the downside. A drop to 1331was followed by a small bounce, and the another move down to 1327. Once again the market bounced, then fell once again until it hit 1326. This completed a 5 wave sequence from the morning’s 1342 high, and wave 5 from 1347. Interestingly, had this drop started at yesterday’s 1334, it would have taken the market to 1317.80, very close to the price we discussed yesterday.

The market attempted to rally from there, but made it only to 1331 before moving lower still. The SPX continued down into the close, reaching 1324.79. This number is significant in that the SPX is now below 1325, and within the range we have been targeting as the termination point from the 1415 high.

While the market has reached the target level from that high, it has not yet reached the target range from 1347, nor 1342, which for both are at the 1319-1320 range. Ideally we would like to see the market hit those levels, reaching the target from 1415 would be sufficient to call this the bottom. We have noticed that when the market closes very close to a target level, but not quite within it, it turns out to be a termination point. That may well be the case here.

The move from 1342 appears as some sort of triangle, with a move to the lower trend line of that triangle bringing the market within both of the above target ranges. These triangle formations can turn into rather extended formations, completing one 5 wave sequence, which turns into wave 1 of another sequence, which forms in ever smaller ranges. Until we break through those trend lines, we can assume that scenario is in play. By our current count, a move above 1331 would mean that all the waves from 1415 have been completed.
We do, however, continue to believe that this is only wave 3 from the 1422 high. We do expect a substantial rally from this point, but it would only be wave 4, and should not surpass the 1422 high. This rally should be followed by another move to new lows. Again, with our current wave counts, the less pronounce the rally, the lower wave 5 will carry. The best case scenario is a move back near 1400, which would be followed by a low only slightly below the current one. Should we see a short-lived rally, wave 5 will project much lower.

Wednesday, May 16, 2012

Wednesday's Market Quick Update

I will be posting a more thorough update soon, but wanted to give a quick update now.

Given today’s action, the alternate count we discussed yesterday appears to be what played out. 1328 was indeed the completion of a 5 wave sequence from 1347, and in turn wave 1 of a larger degree sequence. The wave 2 rally from 1328 ended up being longer than we accounted for yesterday, but from the termination point of wave 2, the rest played out pretty much as we suggested.

The market turned lower from there, and at 1326 completed wave 3, taking out the 1328 low. After a bounce back to 1331, the SPX fell below the 1326 low, down to 1324.79. This puts the Index within our wave 5 target range from 1415, but still slightly above our target of 1319 from 1374. The current 5 wave sequence from 1347 would also have a slightly lower target.

A triangular shape seems to be forming from 1342 wave 2 high, with a drop near the lower trend line completing both the 1374, and 1347 5 wave sequences.

While ideally we would still like to see 1319 to resolve all the wave structures, what we would like doesn’t always happen. With the minimum target level for the move from 1415 having been met, it is time to start considering a bottom. From this point, a move above 1331 would most likely signal the bottom, and a move above 1347 definitely.

Tuesday, May 15, 2012

Tuesday's Market 05/15/2012

After a choppy open, the SPX put in a 5 wave sequence bottom from 1347.32 at 1336.80. The market then rallied back to 1344, before falling to new session lows just above 1335. The market then rallied again, this time moving up near 1345. This completed the semi-inverted corrective wave from 1337, and what we believe was wave 2 from 1347.

The SPX fell back to 1336, before attempting to rally again. This rally cloud only get the market back just above 1340. The selling accelerated during the afternoon, with the SPX falling to a new session low at 1328.41. The market did try to rally once more, but could only make it above 1333, before dropping back down into the close.


We continue to believe we are in wave 5 from 1373.91, and wave 5 from 1415.32. Our projected low from wave 5 from 1415 is 1325-1260, and 1319-1295 from 1374. Therefore the move from 1415 should be between 1319 and 1295. From that point we should see a rather substantial rally. We still do not think this will be the low from 1422, however, as this still appears to be wave 3 from that point.
If our counts are correct, we have only to complete a 5 wave sequence from 1347. Up until now, 1337 seems the most likely point for wave 1, and 1345 for wave 2. From there things are a bit less clear. We see a distinct 5 wave sequence from 1345 to 1336, and another from 1341 to 1328. If these were waves 1-4 from 1345, wave 5 would project to 1319, and we would need to rally from there back to the 1340 level just to project wave 5 of the sequence to terminate within the ranges from 1374 and 1415. While this is possible, it seems unlikely at the moment. Almost all of the solutions possible would require several more waves to play out, while we have always envisioned this stage of the sequence developing fairly quickly.
A stranger, but at this point much more likely scenario, has appeared with the wave action from today. This would put wave 1 from 1347 at 1339.76, followed by an extremely rare, from our experience, expanding corrective wave 2 which ended at 1344.94. This would make the two 5 wave sequences from today’s 1345 high, and the intervening corrective wave, waves 3, 4, and 5 from 1345. We have labeled these points as A1-A5 on the following chart. If this 5 wave sequence in turn becomes wave 1 of a larger degree sequence from 1345, the entire move from 1415 would end with two more sharp moves down, with a small corrective wave in between. This would fit much more closely with our overall scenario. Using our optimal target from 1311 from the 1373 high, this would play out something like 1317.4-1325.2-1311 from 1333.63. These are approximations of course, but in any event wave 5 should be slightly shorter than wave 3.

If we move above 1333, we will stay with our current count, and we could rally back near 1345. 1366 would be the next level to watch, with a move above that likely signaling the end of the current move.