Monday, July 29, 2013

Monday's Market 07/29/2013

On Thursday the SPX completed a 5 Wave sequence higher to 1690.94. On Friday morning the index moved lower, eventually finding itself at 1676.03. Last week I said that it appeared that the SPX had completed a 5 wave sequence from 1604.57 at 1698.38. With the action on Thursday and Friday it seems that I was a little ahead of myself, as that high now appears to have completed a sequence from 1671.84, but not 1604.57. The moves on Thursday and Friday can then be seen as the completion of an inverted corrective wave from 1684.51. This wave took the form 1671.84-1698.38-1680.07-1690.94-1676.03. That 
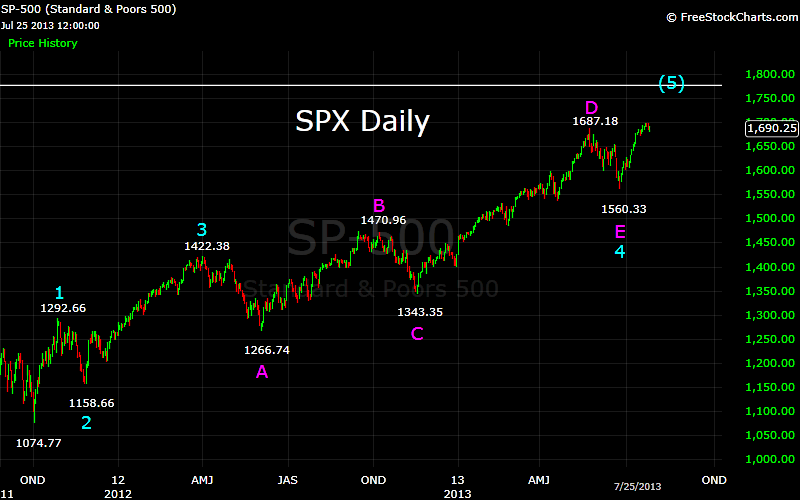
would then complete 4 waves from the 1560.33 low. The optimum target for wave 5 would then be 1778, very close to my ongoing minimum target of 1776.

This morning the SPX started to the downside, reaching 1687 before bouncing back to 1691. The selling then continued through the morning, dropping to a low of 1681.86. After that the index started to rally, rising to 1686 before a small pull back. The rally then continued to 1688.50 by mid-afternoon, which was followed by a larger pull back to 1684.

From the 1676.03 low, the SPX completed 5 waves higher to 1691.85. This was followed by a 5 wave sequence lower to 1681.86. From that low it would appear that the index is forming a more complex wave to the upside.

This has been a very interesting wave, and it should continue to be through the end of the week for obvious reasons. Things can change quickly in a market like this. A move below 1676.03 would indicate my count is incorrect, and may signal a further move to the downside. I am still looking for a move above 1698.38 to confirm the continuation of the current move. My target to the upside remains a minimum of 1776.


Thursday, July 25, 2013

Thursday's Market 07/25/2013

The SPX moved lower this morning, continuing the pull back from yesterday’s 1698.38 high. The index fell to 1690.31 before rebounding, a rebound that took the SPX into positive territory at 1687.05. That in turn led to another move lower, which found the index eclipsing the previous low by a fraction, stopping at 1680.07. The SPX moved steadily higher from there, rising to 1689.42 before pulling back to 1685.04. From there the index again moved higher, making it to 1690.94 before fading into the close.


As I indicated yesterday, the SPX was in the process of forming an inverted corrective wave 2 after the wave 1 drop to 1687.56. This corrective wave did end yesterday at 1686.43, with waves 3, 4, and 5 completing this morning at 1680.31. This turned out to be only wave 1 of a higher degree wave, with wave 2 carrying to 1687.05, followed by waves 3, 4, and 5 completing just below the previous low, at 1680.07. From there the SPX appears to have completed a 5 wave sequence higher at 1689.42. After a small pull back, the index completed another 5 waves at 1690.94.

The SPX seems to have completed a wave 1 at 1689.42. The pull back appears to have occurred in three waves, and with another 5 wave sequence completing above the 1689.42 high, it is likely that the index has not yet completed the current move higher. If the SPX move above 1698.38, the probabilities for a continuation of the uptrend will increase. At this point it looks like my 1718 is still in play on the upside.

If the SPX moves below 1680.07, the most likely stopping point would be 18-20 points below the high from 1680.07, which is currently 1690.94. This would give a target between 1671 and 1673. Otherwise support is still at 1680, and then 1655.


Wednesday, July 24, 2013

Wednesday's Market 07/24/2013

The market gave it a valiant try, but fell just short of managing a new all-time high. After the sell-off into yesterday’s close, the SPX gapped up again at the open, reaching 1698.38, less than a half point from the previous all time high. The index was quickly turned away from those lofty levels, as the SPX sold off rapidly, dropping into negative territory, and hitting 1687.56 before attempting to rally. The rally would not last long; as after rising to 1691.67, the SPX began to fall again, this time moving down to 1682.57. Following that, the index bounced around in a narrow four point range for the rest of the day.


Yesterday I noted that 1696.26 completed a 5 Wave sequence from 1671.84. With the drop yesterday afternoon, followed by the move above that 1671.84 high, the index completed a sequence from the 1604.57 low. This can be counted as 1604.57-1684.51-1671.84-1696.26-1691.52-1698.38. This most likely is the third wave from the 1560.33 low. There are still several ways in which this wave can complete, but my minimum target of 1776 remains intact.


From today’s 1698.38 high, the SPX fell to 1687.56 for wave 1 of this pullback. The small rally unfolded in three waves to 1691.67, and is most likely part of an inverted corrective wave 2. The drop to 1682.57 and small bounce from there may have completed this wave 2. The appearance of in inverted corrective wave indicates that there is still more downside to come before this pullback completes.

There is considerable support within a couple of points either side of 1680, and then 1655 after that.