The SPX opened lower today, continuing the slide
from yesterday afternoon. The index
worked its way below 1874 after the first half hour, and then chopped steadily
lower until it bottomed at 1862.36 by mid-day. After shedding nearly 40 points
in less than three days, the SPX tried to recover through the afternoon,
gaining ten points from the low near the close.

From Tuesday’s all time high of 1902.17, the
decline had been straight forward. The SPX first completed a 5 wave sequence
yesterday morning at 1891.46. The index then completed an inverted corrective
wave just before the close yesterday at 1888.87. Today the index followed that
inverted corrective second wave with a strong move to the downside that ended
at 1862.36. With three waves completed from the high, the expectation would be
for a slight move higher, followed by another move to the downside to complete
the fifth wave. It does appear that the SPX completed a 5 wave sequence from the
low to 1872.49. A 5th wave down from this point would give a target
of below 1837.
This, however, may not play out as outlined above.
Looking at the SPX from the 1891.33 high, I counted a 5 wave sequence that
ended at 1867.02. The ensuing run-up to 1902.17 also completed in 5 waves. These
two waves combined with the 3 waves down from 1802.17 gives us the sequence
1891.33-1867.02-1902.17-1891.46-1888.87-1862.36, which works as a semi-inverted
corrective wave from 1891.33. The three points, (1891.33, 1867.02), (1902.17,
1891.46), and (1888.87, 1862.36) have a correlation of .9994. This would
indicate that the SPX should now move higher, with a first target around 1909. This
fits with my longer term count that the SPX is in Wave 5 from the 1560.33 low,
with a target above 1957, which will in turn complete a 5 wave sequence from
the 1074.77 low.

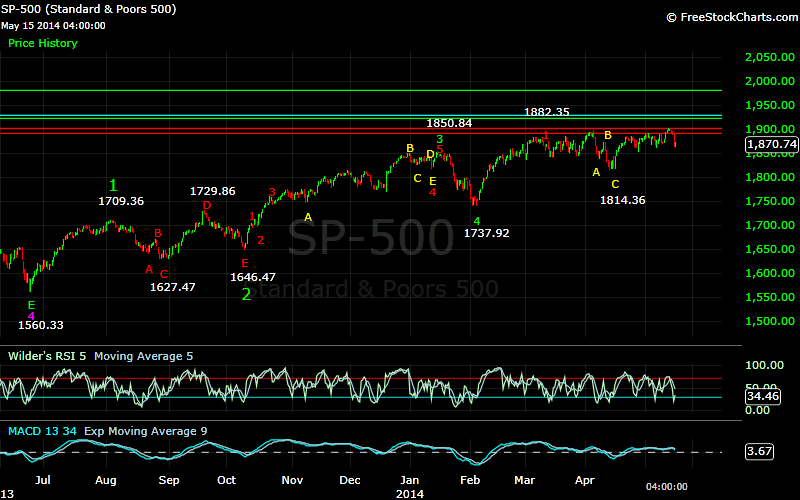
This market has been extremely choppy and complex
from that 1560.33 low, with a multitude of possible ways this thing could end.
This choppiness could continue for awhile, creating maximum confusion before an
eventual correction. For some time every move lower has been accompanied by the
doom and gloom faction calling for a market crash, while every move higher has
heard calls of SPX 2200 and higher. Both are possibilities, but for me the fact
that every market move elicits such diverse reaction lends credence to the
continued choppiness scenario. For the moment it is best to look at this market
wave by wave, while continuing to look at 1957 as the minimum upside target.
Until some confirmation to the contrary changes that, I will use that as my
primary scenario, and try to give points where alternate scenarios may
complete.
Given today’s set-up, I am looking for a move
higher, to near 1909. If the SPX drops below today’s low of 1862.36, the SPX
could be headed below 1837. If the index does move higher, there is a danger
area between 1893 and 1895 that could trigger another pullback similar to the
one we have seen the last few days.


