Friday, November 21, 2014

Thursday's Market 11/20/2014

The SPX gapped down at the open this morning dropping to within .12 of yesterday’s low at 2040.49. The index reversed at that point, closing the opening gap as it rose to 2048.57. After a small pullback the rally continued as the SPX reached 2051.91, and then 2053.84. Once the SPX reached that level, it began to pull back again, first falling to 2050.37, and then 2049.35 before staging another small rally into the close.


As noted previously, the SPX completed a 5 wave sequence from 2001.01 at 2056.08. This completed Wave 3 of a 5 wave sequence from the 1820.66 low, with Wave 4 then completing at 2040.37. From that low the SPX completed a 5 wave sequence at 2052.14 for a wave 1, which was then followed by an inverted corrective wave 2 that completed today at 2049.35.

With what appears to be 4 waves now completed from the 1820.66 low, a target for wave 5 of the sequence can now be calculated. This target is between 2072 and 2126. This is a large range at the moment, but near the 2070 target area mentioned here for awhile. As the current wave unfolds a more accurate range should be able to be determined.


Tuesday, November 18, 2014

Tuesday's Market 11/18/2014

The SPX opened higher this morning, and then gained momentum as it rose to 2049.98. A slight pullback followed, as the index dipped to 2046.42, where it moved ahead once more, finally topping at 2056.08. Once that mark was reached the SPX pulled back again into the close.


I have been looking for the SPX to complete a 5 wave sequence from last Thursday’s 2030.44 low between 2053 and 2063 which would complete the sequence from 2001.01. It looks like this happened today at 2056.08. There is support at 2042, and then 2035. A pullback to either of those levels would put a final rise to above 2070 well within reach.

A move above today’s high without a larger pullback could mean the wave from 2001.01 has not completed, and still has a ways to go.


Monday, November 17, 2014

Monday's Market 11/17/2014

Since falling to 1820.66 a month ago, the SPX has made a strong move to the upside. The rally was swift at the beginning, with the index gaining 100+ points in 13 trading days. Since that point the index has only managed a gain of just over 20 points over the next ten sessions.


Looking at the wave structure from the 1820.66 low, the SPX completed a wave 1 at 1869.00. Wave 2 was then an inverted corrective wave, completing as 1835.02-1949.31-1926.83-2024.46-2001.01. Inverted corrective second waves usually produce a strong move in the direction of the higher degree trend, just as it did here. Waves 3, 4, and 5 are then less explosive, as seems to be the case here thus far. From the 2001.01 low, the index has formed 4 waves, at 2025.32-2015.86-2041.28-2030.44, which generates a target for wave 5 between 2053 and 2063. Once this completes the SPX should pullback, and then move higher once more to complete the sequence from 1820.66. 2070 still seems to be a good target.


There is a possible, but less probable count that has the recent 2046.18 high as the completion of the wave from 1820.66. If the SPX moves below 2030.44 this scenario would become most probable, with a move below 2001.01 likely confirming the top was at 2046.18.


Friday, November 7, 2014

Thursday's Market 11/06/2014

The SPX had a little more upside left, as it opened higher and hit 2025.32 soon after the opening. With a 5 wave sequence from 2001.01 completed, the index pulled back. This pull back took the SPX into the support zone set up by the sub-wave structure and dropped the index took 2015.86. After that the SPX was back into rally mode, as the index rose to 2027.35, pulled back slightly to 2024.10, and then rallied into the close, reaching a high of 2031.61.


With a 5 wave sequence completing at 2025.32, followed by the pullback to 2015.86, and then the move above the wave 5 high indicates a higher degree sequence has yet to complete from the 2001.01 low. There is resistance between 2034 and 2042. Another pullback similar to the 10 point pullback the SPX saw today could occur at that point. If the SPX moves above 2042, 2070 might be the next stop. A move below 2001.01 would likely signal an end to this move.

Off topic for a moment; I think everyone is aware of this, but I found this an interesting read:


Wednesday, November 5, 2014

Wednesday's Market 11/05/2014

On Tuesday the moved lower at the open, falling to 2001.01 before rallying back to 2013.11 near the close. With the index completing 5 waves from the 2001.01 low to 2013.11, and below the previous 2024.46 high, I was expecting the SPX to decline today. This expectation was also partly due to my erroneous interpretation that the move from 2024.46 to 2001.01 was not a complete 5 wave sequence.


After further reviewing my charts, the move from 2024.46 was a complete 5 wave sequence.  The SPX then completed a sequence at 2013.11 as I discussed yesterday. This morning the index gapped higher, reaching a high of 2023.56 a few minutes after the open. The SPX then declined in three waves down, 2016.20-2020.61-2014.42. From yesterday’s 2013.11 to 2014.12 5 waves can be seen as 2013.11-2009.86-2023.56-2016.20-2020.61-2014.42. This completed an inverted corrective wave from the 2001.01 low. The SPX then rallied again to 2022.92, pulled back to 2016.36, and then rallied to 2023.77. Putting this all together from the 2001.01 low gives 2001.01-2013.11-2014.42-2022.92-2016.36-2023.77, which completed a 5 wave sequence.

Despite the initial intensity of this morning’s move, the SPX failed to take out the previous 2024.46 high. Three times it came within two points of that mark; with two of those getting within one point, and three times the index was turned back.

Given the completion of a 5 wave sequence today at 2023.77, the expectation would now be for the SPX to decline. Near term support is at 2019 and then 2011. Longer term support is at 1999, and then 1943. The SPX again appears to be at a decision point. My upside target remains 2070, and a move above 2024.46 would likely signal a continuation of the move from 1820.66 to that level.


Tuesday, November 4, 2014

Tuesday's Market 11/04/2014

The SPX started off lower this morning, continuing the decline from 2024.46. After initially falling to 2011.28, the index tried to rally, but only made it to 2015.98 before turning lower once again. This leg took the SPX down to 2001.01, which proved to be the low of the day, and then rallied into the close.


My count from the 2024.46 high has a first wave down at 2022.31. The SPX then formed an inverted corrective second wave that completed with today’s first rally to 2015.98. The third wave was the subsequent decline to 2001.01 and the fourth the rally back to 2013.11. The index actually hit a high of 2013.87, but I see the end of the wave as 2013.11.

Given this count the target for the fifth wave is 1993-1998. Therefore I would look for the SPX to decline to that level, and then move higher. First resistant would be near 2010 given this scenario. A move above 2015.98 from current levels would mean that my count is wrong.


Monday, November 3, 2014

Monday's Market 11/03/2014

Over the weekend I mentioned that I was looking for three waves higher from Friday afternoon’s 2010.77 low to complete a 5 wave sequence from the 1820.66 low. The SPX opened slightly higher, and then chopped its way up to 2021.49. From there the index pulled back to 2014.17 before moving to a new high at 2024.46. Once reaching that level, the SPX then moved lower for the rest of the day, before bouncing slightly higher into the close.


I was looking for something like 2028-2019-2035 to complete this sequence, but the SPX did not quite reach those targets, completing the last three waves as 2021.49-2014.17-2024.46. This does look to complete the sequence from 1820.66.

I would be looking at a preliminary target of 1943 for this decline. A move above 2024.46 would mean that the near term top is not in yet.


Sunday, November 2, 2014

Weekend Outlook 11/02/2014

Six weeks ago the SPX reached an all time high of 2019.26. This week, the index traded just below that mark at 2018.19. Usually this would be described as a sideways trading range, but it felt like anything but. After hitting the all time high, the SPX embarked on the largest decline in over three years. After falling to a low of 1820.66 the index has rallied for two straight weeks, lifting the SPX back within two points of the all time high. A review of my count from the March 2009 666.79 low may put some of this recent action into perspective.


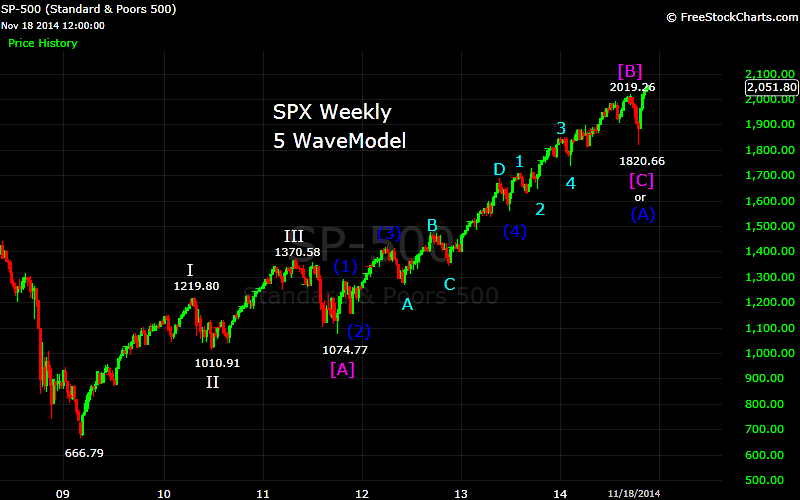
From the 666.79 low, the SPX rallied to 1219.80, forming the first wave of the current 5 wave sequence. A pullback to 1010.91 completed the second wave. The third wave took the index to 1370.58, and the fourth to 1074.77. The fifth wave was the just completed extended rally from 1074.77 to the recent all time high of 2019.26. While 5 separate waves have formed, this did not complete a 5 wave sequence, meaning that a complex corrective wave is forming. My current count from 666.79 is this:

Wave 1 – 1219.80
Wave 2 – 1010.91
Wave 3 – 1370.58
Wave A of 4 – 1074.77
Wave B of 4 – 2019.26
Wave C of 4 – 1820.66

This would put the SPX in Wave D of 4. The rest of the sequence from 666.79 may play out something like this:

Wave D of 4 – 2035
Wave E of 4 – 1930
Wave 5 – 2070

In my model, the first, third, and fifth waves of a given sequence are proportional. Wave 1 of this sequence was about 550 points and Wave 3 about 360 points. This implies that Wave 5 will have to be considerably less than 360 points. While in theory Wave C of 4 could have been longer than Wave A of 4, and thus Wave E of 4 longer still, this would not have allowed Wave 5 to reach new highs. With Waves A, C, and E of 4 becoming increasingly smaller, it does allow for a higher high. This is my working count, but by no means the only possibility. It is simply the one that fits all the data up to this point.


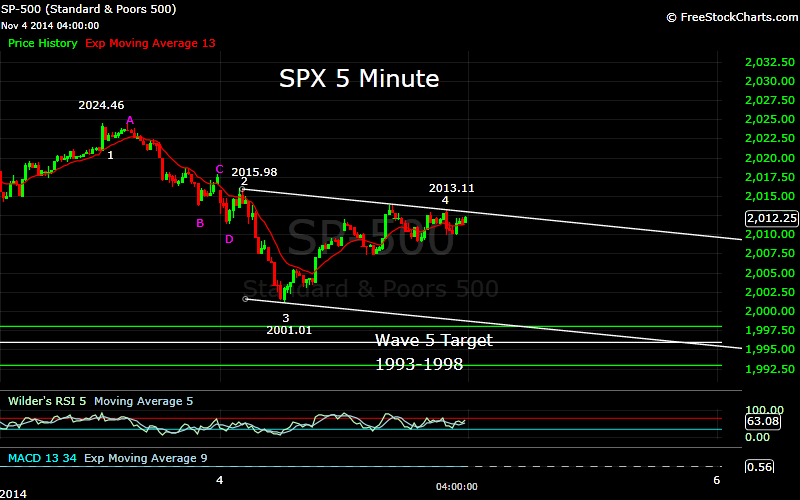
Looking at the 1820.66 low as Wave C of 4, I am now tracking the advance from that point. When a 5 wave sequence from that point completes, it should complete Wave D of 4. This sequence completed the first wave at 1869.00. From that point it had been forming an inverted corrective wave. As of my last post, I had identified three waves of this sequence at 1835.02-1949.31-1926.83, and given a target of between 2006 and 2021 for the fourth. Friday morning the SPX hit a high of 2017.45, within this range, and looks to have completed the fourth wave at this point. I had mentioned earlier in the week that once this wave completed I would expect a pullback of something less than 22 points. This was based on the first two pullbacks of 34, and then 22 points. The decline into Friday afternoon to 2010.77 thus could have completed Wave E of 2, and the entirety of that wave. With two waves now completed from 1820.66, I am looking for three waves higher to complete the sequence. I am currently looking for something like 2028-2019-2035.

This would complete Wave D of 4 as I discussed in my longer term count above. 

Tuesday, October 28, 2014

Tuesday's Market 10/28/2014

The SPX opened higher, moving up to 1973.35. After pulling back to 1969.02, the index resumed its climb. These first two moves were consistent with the targets given yesterday. From that point the SPX strayed slightly from my forecast, as the wave became more complex than expected. Since Wave 2 of the wave from the 1951.37 low was a complex inverted corrective wave, I expected Wave 4 to be a simple wave. It looks like it instead was also an inverted corrective wave, which carried the index to 1983.68 before completing at 1980.35. The final move higher today likely completed the sequence from 1951.37.


Short term the SPX could experience a pullback at the open tomorrow, with support at 1979, and then 1964. If 1979 provides support, the upside target from there would be 2010. If the index falls back to 1964, 1996 would be my target.


Monday, October 27, 2014

Monday's Market 10/27/2014

The SPX has been rallying since it hit a low of 1820.66 on October 15th. The index made an initial move to 1869.00, which I am counting as Wave 1 of a 5 wave sequence to the upside.  From there the SPX pulled back to 1835.02. This looks to be Wave A of an inverted corrective Wave 2. As is often the case, Wave B of this inverted corrective wave has been the most powerful to this point. This wave carried the SPX up to 1949.31. Another pullback to 1926.83 followed which I have labeled Wave C of 2. Wave D is currently underway, with a target of 1975. After this wave completes, the SPX should pill back once more to complete Wave E, and the inverted corrective Wave 2. This pullback should be proportional to the first two pullbacks, with the first being 34 points, and the second 22 points.  This last pullback should therefore be slightly less than 22 points, and I currently have a target of 1956. After that the SPX should move higher to complete Waves 3, 4, and 5.


Shorter term, the SPX from the 1926.83 low completed the first wave at 1961.95. Wave 2 completed this morning at 1951.37. I am looking for Wave 3 to complete at 1970, Wave 4 at 1967, and Wave 5 at 1975. If this plays out, the move lower to 1956 discussed above would follow.


Thursday, October 23, 2014

Thursday's Market 10/23/2014

The SPX moved higher from the opening bell today, rising to 1849.56. After a small pullback the index rose first to 1953.09, and then 1957.65. The first substantial pullback followed from that point, as the SPX fell to 1951.82. After that one more move higher occurred, taking the index to 1961.95. From that point the SPX began to pullback in earnest, falling to 1949.11 before bouncing back to 1955.15. One final move lower took the index down to 1948.12 shortly before the close.


As I discussed yesterday, the SPX completed a 5 wave sequence from the 1835.02 low yesterday at 1949.31. This looks to be the first wave of a larger degree sequence from that low. The first three waves of an inverted corrective Wave 2 occurred yesterday, with today’s rally completing the fourth wave.  The current decline looks to be the fifth wave.

Given this count the SPX should continue lower tomorrow, with a target of 1935-1933. After that I would look for a continuing of the advance from 1835.02, with a target of 1980.