Friday, April 11, 2014

Thursday's Market 04/10/2014

The SPX started slightly to the downside, dropping to 1868.46 before rallying to 1872.53. This was just above yesterday’s 1872.43 high, and completed a 5 wave sequence from 1837.49. It was not surprising that the sequence completed just above yesterday’s high considering the extent of yesterday’s run-up, and the extreme overbought conditions it created. A pullback at some point was expected, however the extent and speed of it was. Once the sell-off started, it continued nearly unabated to 1840.03. From there the first semblance of a rally appeared, and the index moved up to 1847.55. Another wave of selling took the SPX down to 1830.87 before another rally moved the index to 1839.12. The SPX then sold off into the close, dropping to 1833.42.


When the SPX fell to 1837.49 last Tuesday, it appeared the correction from 1882.35 was finally over.  While that may still be the case, today’s action keeps open a couple of scenarios that seemed to have been relegated to back up status.

I will try to take this one step at a time, so I will start from the current move from today’s 1872.53 high. The SPX completed a 5 wave sequence to the downside at 1840.03. From there the index rallied just less than 8 points, fell to 1830.87, and then staged a rally of just over 8 points. If the SPX opens lower, it would complete a 5 wave sequence at 1828. If the index opens to the upside, it would complete an inverted corrective wave at 1841. This sets up my first support, and resistance levels. The first scenario could mean an end to the current decline; the second would indicate further downside ahead.

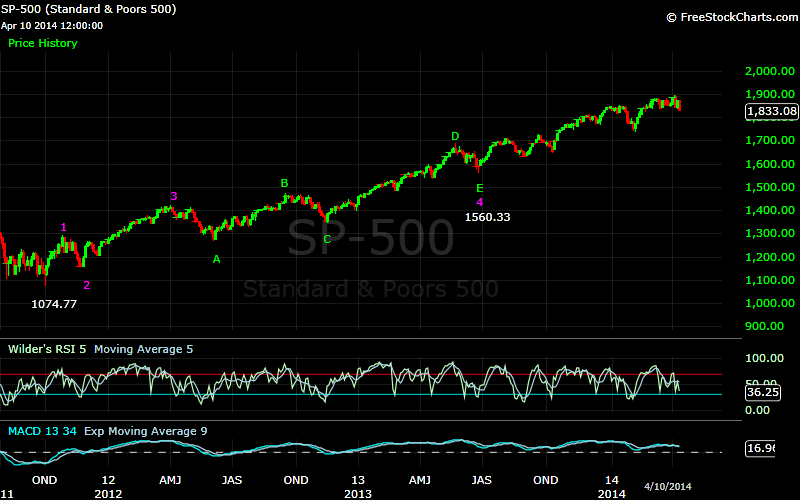
Moving out to my current view that the SPX is currently in a wave 5 from the June 1560.33 low, Wave 1 of 5 would have completed at 1882.35. It is now apparent that the sequence to 1837.49 was not the end of the decline from 1882.35, but could be the beginning of an inverted corrective wave with the decline to 1837.49 as a wave A, the rally to 1872.53 a wave B, with wave C currently underway. Support for this scenario would be 1827, and then 1803. This scenario would result in higher prices, with the minimum target being 1957 as I have mentioned.

The second possibility is that the SPX is still in an inverted corrective wave from 1709.36. This has been my alternate scenario, and would target 1758.


Wednesday, April 9, 2014

Wednesday's Market 04/09/2014

The rally off yesterday morning’s 1837.49 low continued today, giving credence to the idea of that being an important low. Looking at the move from that low, the SPX completed a wave 1 at 1850.46. That was followed by an inverted corrective wave to 1847.67. This correction took the shape of what is more commonly known as an expanding triangle. From that point the SPX formed 5 waves up to 1858.38, which was followed by a pullback to 1852.38. Another 5 wave sequence to the upside took the index to 1869.86, and was again followed by a small pullback, this time to 1866.33. This looks to complete a more complex inverted corrective wave from the 1850.46 wave 1 high, which completed as 1847.67-1858.38-1852.38-1869.86-1866.33.


This set-up indicates that there is further upside to this move. I continue to count this as Wave 5 from the June 2013 1560.33 low. The 1837.49 low yesterday would mark the completion of Wave 2 of 5 from that point, with a minimum target for Wave 3 of 1909. Once this sequence from 1560.33 completes, it should also complete a sequence from the October 2011 1074.77 low. The minimum target for the completion of this wave is 1957, with an optimal target of 2001.


Tuesday, April 8, 2014

Tuesday's Market 04/08/2014

Since the SPX hit 1882.35 on March 11th, the index has been in a protracted corrective wave that contained many twists and turns. This wave seemingly started off as a simple corrective wave, turned quite complex after dropping to 1839.57. But this complex wave may have ended today at 1837.49.


The most apt description of this wave is a semi-inverted corrective wave. Wave A came quickly with a drop to 1854.38. Wave B was the wave that at times seemed too complex and unusual, but eventually managed to resolve itself with the all time high of 1897.13. Wave C ended Friday at 1863.26, and was followed by an inverted corrective Wave D which ended yesterday at 1852.77. The drop this morning to 1837.49 would seem to complete Wave E, and a 5 wave sequence from the 1882.35 high.

It is now likely that the SPX will again move higher, reaching that 1909 minimum target I have talked about previously. A move below 1837.49 at this point would indicate something else is occurring, with another sequence lower to come.