Saturday, August 31, 2013

Friday's Market 08/30/2013

Following a virtually flat open, the SPX bounced slightly to 1640.08 before drifting lower through the morning hours of Friday’s trading session. BY mid-day the index had fallen to 1630.85 with only small bounces higher. At that point the SPX bounced again to 1634 before making another move lower to 1628.43. That’s when things got interesting. The index rose sharply to 1636, fell back to 1631, and then rose again to 1635.80. That move was short-lived, as the SPX fell again to a new intra-day low at 1628.05, before rising quickly in the last few minutes of trading to 1634.06.


Counting from Thursday’s 1646.30 high, the SPX completed a 5 wave sequence at 1633.91. This is denoted by the yellow “C?”. After a small bounce higher to 1636.42, the index then completed an extremely complex 5 wave sequence that terminated at 1628.05. This can be then counted as 3 waves down from the 1646.30 high. Looking at the 15 minute chart from the 1627.47 low, I have been counting the move to 1646 as 3 waves higher, 1641.18-1630.88-1646.41. I have mentioned in the past a complex corrective wave that I refer to as a semi-inverted corrective wave. This type of wave has very specific properties, but is difficult to identify during its formation. If the trend is higher, the first wave of this corrective wave is to the downside. The second wave is to the upside, and carries above the previous high. The third and fourth waves complete within the Wave 1 high and the Wave A low. The fifth wave finishes below the third, but above the origin of Wave 1.

Looking at the entire move from 1627.47, the move to 1641.18 can be labeled Wave 1. 1630.88 can then be considered Wave A, and 1646.41 Wave B. The first wave lower from 1646.41 completed at 1633.91, which is within the 1630.88-1641.18 range, and the second wave, 1636.42, within that same range. The last move, to 1628.05, completed below 1630.88, and above 1627.47. This sequence must also satisfy my model’s criteria for a completed wave, which it does. It seems likely, at this point, that the move from 1627.47 to 1641.18 was a Wave 1, and the subsequent move to 1628.05 a complex corrective Wave 2. These types of waves generally result in extremely powerful and swift moves.

The SPX now could have, by my count, completed 5 waves down from 1709, and near the 1621 support level. Considering that the type of wave that may have completed Friday, the market may be ready to start a sustained rally. While I am not ready to call this the end of this corrective phase, I think it is becoming a real possibility.

A move below 1627.47 obviously invalidates this scenario. Support remains at 1621. Resistance is at 1651, 1669, and 1685.


Thursday, August 29, 2013

Thursday's Market 08/29/2013

As I indicated may be the case yesterday, the SPX opened to the downside, gapping lower to 1630.88. The index moved sharply higher off that low, quickly surpassing yesterday’s 1641.18 high before pausing. Following that slight pause, the index continued higher, moving to 1645.62, and then chopping higher until it reached 1646.41. After that the SPX turned lower for the remainder of the day, dropping back to 1643 by early afternoon. After a bounce to 1645 the index fell to 1640, and after another bounce to 1643, fell back to 1636.69 by the close.


I mentioned yesterday that the SPX may complete a 5 wave sequence at 1630, and if it then rose above the 1641.18 high, that it may continue to rally towards 1651. The index did complete that sequence this morning at 1630.88, and then moved above that high. The rally fell short of the 1651 level, as the SPX lost most of its gains by the close. The index appeared to complete a sequence higher at 1646.30, marking the third sequence from the 1627.47 low, as 1641.18-1630.88-1646.30. The move lower from that high does not appear to have completed a sequence.

At this point, the three waves higher off the 1627 low would seem to be part of a complex corrective wave, and it is still likely that the SPX will move lower, possibly into the 1621 support level, to complete a sequence from 1669.51. There is a possible count that points to this area as completing a 5 wave sequence from the 1709.24 high. A move to 1621 would complete that sequence right at a support level. Looking longer term, there are three likely scenarios. The first and the one I have spoken most about, calls for the SPX to rally to the 1685 level, before making another leg down to 1540. The second would have the SPX rallying, but falling short of 1685, and would likely lead to a low below 1540. The third has this as the end of the corrective phase, and would be followed by new all-time highs. I have not been convinced that this correction would carry below 1560, so at the moment, this is the scenario that I would favor. A lot will depend on the support/resistance level that I have mentioned, 1621, 1651, 1668, and 1685. A move below the 1621 level would favor the most bearish scenario at this point.

Yesterday I gave a scenario of this wave playing out as 1621-1628-1618, and that still seems to be a good guideline. A move above 1646 would point to 1651, and then 1668 as the next resistance levels.


Wednesday, August 28, 2013

Wednesday's Market 08/28/2013

The SPX started off slightly to the downside this morning, taking out yesterday’s low by a slim margin before moving higher. That opening move took the index to 1627.47 where it quickly reversed direction. The SPX soon was above 1634, and after a brief four point pullback, continued higher to 1637.37. After another minor pullback, the SPX started a third leg higher for the day, with this one carrying to 1641.18. From that point the index digested its gains into the close, first falling back to 1639, and then 1635.34. After a bounce higher to 1640.12, the index fell to 1635.10 near the close.


Yesterday I said that I expected the SPX to move higher, and after the initial drop to 1627 it did just that. 1627 appears to have completed a 5 wave sequence from 1669.51, but there are some that indicate that may not have completed the entire wave from that point. From the 1627.47 low the SPX completed a 5 wave sequence higher as 1634.07-1630.44-1637.37-1634.99-1641.18. It appears that the index is in the 5th wave from that high, but has yet to complete a 5 wave sequence.

With that in mind, it is likely that the market should move lower. Given the waves already completed, it would complete a sequence at 1630. If the SPX moves down to 1630, and then back above 1641, I would then expect the move higher to continue to 1651.


The move to 1641 failed to reach certain parameters that would be indicative of the completion of the wave from 1669.51. If the SPX continues lower, and breaks below 1627, this move is likely to continue to 1618. This may play out as 1621-1628-1618. This would allow this third wave from the 1709 high to complete very close to the 1621 support level. From that point the SPX could rally.

Tuesday, August 27, 2013

Tuesday's Market 08/27/2013

The SPX opened with a gap to the downside, dropping initially to 1640.36, which was followed by a small bounce, and then 1638.24. After another bounce that lifted the index to 1643.99, the SPX spent the remainder of the trading session drifting ever lower, finding the low of the day at 1629.05 shortly before the close.


Today’s action in the SPX would appear to be a continuation of a single wave from yesterday’s 1669.51 high. From that high, the index completed the first wave lower at 1666.76. After then completing waves A, B, and C of an inverted corrective wave, the index began to form wave D, which began to sub-divide. The first 4 waves completed near the close yesterday afternoon, and completed this morning when the SPX reached 1638.24. The bounce off of that low to 1643.99 then completed wave E, and the inverted corrective wave 2 from 1666.76. As the market drifted lower this afternoon, it appears to have completed waves 3, 4, and 5 from that high at 1634.27-1638.42-1630.41.

Looking at this entire move from the al-time high of 1709.36, I count an initial wave down at 1684.91. From there the SPX completed a complex inverted corrective wave that went 1700.18-1646.00-1661.83-1654.81-1669.51. The wave that completed today at 1630.41 thus completed the third wave down from the all-time high. Given that scenario, I would expect the market to move higher at this point, before completing one more move down.

Since this move began, I have pointed to four levels of support/resistance. Those levels have been 1685, 1669, 1651, and 1621. The initial move lower reached the 1685 support level, with the next move lower pausing at the 1651 level before breaking below it. The recent high took the SPX to the 1669 resistance level. A move back to 1651 at this point would target 1621 as the low of the 5th wave from 1709.

If this scenario plays out, the market will be at a very decisive point. As I articulated before, a move to 1621-1685-1540 would complete a semi-inverted corrective wave from 1687. I am still not convinced that this move will carry below 1560, so if the SPX gets back to 1685, there is a good chance that it will continue higher. There are still several ways in which this market can go, so at this point it is best to keep a close watch on the critical levels. If the SPX fails to reach 1651, it could be headed much lower. A decisive break of the 1621 level would also point to lower levels. If the SPX can find support at 1621, and then rally above 1669, it could be an indication that this corrective wave may be over.


Saturday, August 17, 2013

Friday's Market 08/16/2013

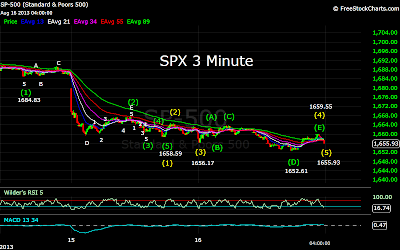
Coming off the brutal down move from yesterday, the SPX had a somewhat calmer session today, trading within a narrower 13 point range, but still moving to the downside. The index started slightly to the downside, and shed several more points as it fell to 1656.17. The SPX then started to move to the upside rising first to 1662.43, and then 1663.60 after a small pullback. That high brought on another round of selling, as the index fell into the afternoon, hitting another near term low of 1652.61. Another rebound followed, but after rising to 1659.55, the SPX fell again into the close.


Yesterday I said that the SPX had completed a 5 wave sequence down at 1658.69, would likely experience more movement to the downside, with support at 1651, and then 1621. The SPX did move further to the downside today, and made a low at 1652.61. It appears that the index completed a larger degree sequence from the 1709 high today. Using yesterday’s 1658.69 low as Wave 1, the rebound to 1664.58 was Wave 2. This morning’s drop to 1656.17 completed Wave 3, and was followed by an inverted corrective wave 4 that completed at 1659.55. The late afternoon fade to 1655.93 would then appear to complete Wave 5, and the entire sequence from 1709.

The SPX has now completed a 5 wave sequence from 1709 right at the first support level. This was accompanied by extreme RSI(5) readings on the 60 Minute chart, and a positive divergence. The short term chart shows a lower RSI(5) reading as compared with the 1652.61 low, with a higher index level. This also could be a short term positive. A move above 1660 would likely indicate that a rebound is underway, with resistance at 1669, and then 1685. Support is at 1651, and then 1621. A move below the 1651 area would indicate the SPX may be headed to the next support level.

While it is still possible that this is the end of the correction, and that the market is on its way higher, it is becoming more and more likely that there is a substantial move down ahead before the move higher can begin.  My reason for the 1776 target level has been the longer term count as seen on the Daily chart. I have counted Waves 1, 2, and 3 completing as 1292.66-1158.66-1422.38. I then saw an inverted corrective wave completing as 1266.74-1470.96-1343.35-1687.18-1560.33. The alternative counts would require many more waves to complete before the end of the uptrend from 1074.77, and seemed very unlikely. A very interesting alternative has begun to emerge. In this scenario, everything up to the 1687.18 high would remain the same. It is then possible for Wave E of that large inverted corrective wave to be forming a complex wave, in this case, a semi-inverted corrective wave. Wave A would be the move from 1687.18 to 1560.33. Wave B from 1560.33 to 1709.24, and Wave C underway. In these complex waves Wave C would need to complete above 1560.33, Wave D below 1687.18, and then Wave E below 1560.33.

As I have mentioned, support is at 1651, and then 1621, both above 1560.33. Resistance is at 1669, and then 1685, both below 1687.18. The other thing I need to keep n mind is the fact that the end of this wave must also complete within the range to complete the longer term inverted corrective wave, which has a lower boundary of 1542. This gives a fairly narrow range to work with, as this wave must then complete below 1560.33, and above 1542. An initial move to 1651 or 1621, followed by a rebound to 1685, would both satisfy those conditions. In the first case Wave E would project to 1651, and in the second, 1654.

In essence this means that the entire move from 1687.18 could be one complex correction, projecting a low of between 1560.33 and 1542. Since the low of this move would approximate the 1560.33 low, the ensuing move higher would project into the same range, namely the 1776 area.


Thursday, August 15, 2013

Thursday's Market 08/15/2013

After finally completing a 5 wave sequence from 1709 yesterday, the market took little time deciding on its next move. After a small bounce yesterday afternoon, the SPX gapped down n a big way this morning. The index fell below 1670 at the open, and continued lower until it reached 1659. The SPX tried to recover from that point, but could only make it to 1668 before turning lower once again. The index finally hit the low of the day at 1658.59, after tumbling nearly 27 points. From that point the index moved slightly higher to 1664.58, and then ended the day trading within that narrow range.


I mentioned yesterday that the SPX had finally completed a 5 wave sequence from 1709 at 1684.83. The drop today was then part of an inverted corrective wave that ended at 1667.60, with the index then completing a higher degree sequence from 1709 at 1658.59. This move invalidates my longer term count from 1560.33, which I had been viewing as a Wave 1 to 1626.61, and was being followed by an inverted corrective wave. The next most likely count has three waves completing from 1560.33 to 1709.24, with wave 4 in progress now. This count would still project a wave 5 high in the 1776 range I have been mentioning.

The next possibility is that the SPX completed 5 waves from 1560.33 to 1709. This would open up several options, but generally point to a low above 1560, with an ensuing high around 1776.

The SPX hit extreme oversold readings today, and so it would not be surprising to see a bounce at any point, but it is likely that there will be some more movement to the downside.

Support is at 1651, and the 1621, with resistance at 1669, and then 1685.


Wednesday, August 14, 2013

Wednesday's Market 08/14/2013

Similar to yesterday, the SPX moved slightly higher at the open, and then quickly rolled over. After falling to 1691, the index bounced back to 1694 before falling further. This downside action, with small bounces continued until the SPX had fallen to 1684.92. From there it bounced to 1689.50 before falling once again into the close, holding just above the 1684.92 low.


This market has been frustrating since the 1709 high in the sense that it had not completed a clear 5 wave sequence from that point. Although the SPX had reached a level where an inverted corrective wave from 1626.61 had likely completed, it was difficult to know exactly where in the count the market was. Compounding that fact, the inverted corrective wave could possibly have completed in two distinct ways, one requiring a 5 wave sequence from 1709, and the other needing 3 waves from that high. Today, for the first time, I can count a 5 wave sequence from that high.

I chose to show the 5 Minute chart today since it shows the whole structure from 1709. The SPX first completed a wave 1 at 1704.32. This was followed by an inverted corrective wave 2 that completed at 1700.18. Wave 3 completed at 1688.38, and was followed by another inverted corrective wave, this time for wave 4, which completed at 1696.81. Wave 5 then completed today at 1684.83.

This sequence completed within the area needed to complete an inverted corrective wave from 1626.61. 1676 is the lower limit of this completion zone, so if the SPX falls below that level, I would be looking for further downside. It is still possible that this only completes Wave C of that inverted corrective wave, which means we should see a rally, followed by another pullback similar in magnitude to this one. A move above 1709 would signal a resumption of the uptrend, which should carry to a minimum of 1776.


Tuesday's Market 08/13/2013

The SPX opened slightly higher this morning, hitting 1692.99 before quickly changing direction. After that initial move higher the index fell to a new short term low at 1682.62. The bulls finally gained some momentum, as the SPX changed course again, and rose sharply into mid-afternoon. It reached a high of 1696.81 before turning choppy, and drifted lower into the close.


Although the count from 1709 high has been difficult to say the least, it would still appear that the SPX has completed a complex corrective wave at 1683. This still supports a move to new highs, with my target remaining at a minimum of 1776.

The short term count from today’s low appears to indicate a move higher, and if so, would project to above 1705. It looks like this may be the markets best chance of breaking out to new highs. If it fails to do so, the bears may get another chance to take it down further.

I am still looking for a move above 1709 to confirm a resumption of the uptrend. Below the 1683 level, support is at 1676, and then 1668.


Monday, August 12, 2013

Monday's Market 08/12/2013

The market kept to the same script we saw much of last week; an opening gap down to start the day, followed by a slow drift higher into the close. Although the patterns were similar, there was one key difference worth noting. In all the instances last week, with the exception of last Monday, the initial move to the downside did not hold as the low of the day. Today it did. It is also worth noting that today’s action was identical to last Monday’s trading action; a gap down to open, followed by a lower high, a higher low, and then another lower high. That pattern led to a move lower into today. Last Monday, however, the market was coming off overbought levels at the 60 minute time frame, while today the SPX hit oversold with a positive divergence.


As I mentioned above, the SPX gapped down at the open today, and took out the 1684.91 low along the way. The index rallied almost immediately from that point, rebounding to 1691.49. After that, the SPX moved lower, dipping to 1686.34, before rebounding into the close.

The move below 1685 took the 1604.57-1698.38-1676.03-1709.24-1684.91 inverted corrective wave scenario I had talked about over the weekend out of play. Last Friday, the Dow made a new short term low, while the SPX did not. That index seemed to complete an inverted corrective wave with the last three waves forming a zig-zag from the 15655.75 high. Today, the SPX hit a new short term low, while the Dow did not. It would appear that the SPX has completed an inverted corrective wave in the same fashion. As I noted over the weekend, the move from the recent 1684.51 high has been difficult to follow. Over the weekend I treated 1698.38 as the end of the wave from the 1604.57 low, but it now appears that wave carried all the way to 1709.24. The inverted corrective wave can then be counted as 1604.57-1709.24-1684.91-1700.18-1683.35. This seems to be supported by the fact that the move from 1709.24 to 1683.35 appears to have completed with 3 waves.


It is still possible for the market to move further to the downside, with support at 1676, and then 1668. I still expect the SPX to move higher, with a minimum target of 1776. A move above 1709 would likely confirm that.


Sunday, August 11, 2013

Weekend Outlook 08/11/2013

After the SPX hit a low of 1560.33 on June 24th, the index advanced in a relatively easy to follow manner until it reached 1684.51 on July 15th. The SPX completed a 5 wave sequence higher to 1626.61, which was followed by a corrective sequence, and then another sequence higher to 1684.51. Since that point, the index has traded in a fairly narrow range, bounded by 1672 on the lower end, and 1709 on the higher end. The price action during that span has been quite choppy, and difficult to track on a short term basis. During each sequence, the market tends to reach a point of indecision that tests the resolve of participants. It seems we are at that point now. At times like these, it is best to consider all possibilities, determine the most probable course of action, but be prepared for other potentialities.

After reaching an all time high last Friday of 1709.36, the SPX opened lower on Monday, rallied to challenge that high at 1709.24, and then traded flat for the remainder of the day. On Tuesday and Wednesday the index opened markedly lower, and then drifted higher onto the close. On Tuesday the SPX hit a low of 1693, and 1685 on Wednesday. Thursday saw a gap up open, followed by a drop to close the gap, and then a rally to just below the opening highs. The SPX opened lower again on Friday, tested the 1685 low, but held above it, and then moved higher.


When considering the possible short term direction of the market, it is important to also understand where the market is on a larger scale. Starting with the weekly chart, the SPX has completed 4 sequences from the 666.79 low. These completed at 1219.80-1010.91-1370.58-1074.77. It is not possible, given the sequences already completed, for a larger sequence to terminate with this uptrend. The SPX is forming a complex corrective wave, with the implication being that this bull market has further to run after this uptrend completes. Using the sub-waves of the move from 1010.91 to 1370.58, the minimum projection for the current uptrend would be 1708, which we have surpassed. The range for this sequence is admittedly somewhat large, but it gives an initial target. My current target of 1776 also falls within this range. One technical point of note on this chart is the RSI(14). Notice at the 1010.91 low, this indicator bottomed at 38.05, while it reached a lower low of 29.67 when the market corrected to 1074.77. This lower low on the RSI(14), coupled with a higher price low, is seen often during the formation of complex corrective waves.


The Daily chart clearly shows the SPX in the ninth wave from the 1074.77 low. This is supported by not only the sub-wave counts within each individual wave, but by technical indicators such as the RSI(14), and the MACD. My current count has waves 1, 2, and 3 completing at 1292.66-1158.66-1422.38. This was followed by an inverted corrective wave 4 at 1266.74-1470.96-1343.35-1687.18-1560.33. The three declines during this period were 156, 128, and 127 points. Notice the proportionality of those declines, and the fact that the declines decrease as the starting points increase. Given this count, Wave 5 projects to a minimum of 1776.


Cutting through all the noise, and looking strictly at the 60 Minute chart from the 1560.33 low, it certainly appears as if the SPX completed a wave 1 at 1626.61, and has been followed by an inverted corrective wave 2 at 1604.57-1698.38-1676.03-1709.24-1684.91. These declines have been 22.04, 22.35, and 24.33 points. Again the lengths of the declines have been similar, and have increased slightly as the starting point has increased. Also notice the lower RSI(14) readings at points A, C, and E. Lower readings on the indicator, coupled with higher lows on the index. This count would suggest that 1684.91 was the low, and the SPX should now continue higher from here.

Given my target of 1776, the likely course of action would be a move to around 1748, followed by a pullback, and then another move higher to 1776. Shorter term, I have an initial upside target of 1711.

That is my case for the bullish scenario. It is possible, given the action of the market lately that this will not play out as I suggest. If the SPX breaks below 1685, the next likely target is 1668. Even if 1685 does not hold, I expect to see 1776 before 1560. 

Thursday, August 8, 2013

Thursday's Market 08/08/2013

It was an encouraging opening for the bulls this morning, as the SPX gapped higher, and quickly surpassed the 1700 level once again, settling at 1700.18. That bullish spirit did not last long however, as the index sold off sharply, dropping into negative territory, and falling to 1688.38. The bulls took control again at that point, moving the SPX back near the day’s high to 1699.75. After a small pullback, the index moved back above 1700 for the second time, hit 1700.14, and then turned choppy as it moved lower into the close.


This morning’s move higher seems to have completed a 5 wave sequence from yesterday’s 1684.91 low. After a corrective sequence lower to 1688.38, the SPX completed another sequence to 1699.75, which was followed by a semi-inverted corrective wave that completed at 1697.50. If this count is correct, I would expect the SPX to move higher from this point.

My target for the current move remains at 1776. It is still best to be cautious at this stage. If the SPX can clear 1709, the probabilities of reaching that target increase. If the index moves below 1685, I am looking for support at 1676. Resistance is at 1710, and then 1736.


Thursday Count Update 08/08/2013

I apologize for not having been able to update for the past several days, but while I have the chance, I thought it a good time to update my counts.

Looking at the hourly chart, I had a 5 wave sequence completed at 1626.61, and then a corrective sequence to 1604.57. I then counted a sequence to 1684.51 as essentially the same degree as the first two. It now appears that sequence was two degrees lower than I thought. That high was followed by an inverted corrective wave that ended at 1676.03. Up to that point the waves had been fairly easy to follow, but after that the waves became quite difficult to track. The pullback of the last several days seems to have clarified those waves. The waves became quite choppy, but the first two moves higher can be counted as completing a sequence from the 1604.57. That can be counted as a Wave 1, which was followed by Waves 2 and 3. Wave 4 was then another inverted corrective wave, and finally Wave 5 to 1709.24. This is a bit clearer on the 15 minute chart.


Yesterday the SPX completed a 5 wave sequence to the downside at 1684.91. The action today seems to confirm that.

My target of 1776 has not changed up to this point. It still seems like the most probable course of action for the market. With the move from 1604.57 to 1709.24 being one sequence, there is a chance of a further correction, so I will remain cautious, until the SPX moves above 1709.24.


Monday, August 5, 2013

Monday's Market 08/05/2013

Last Wednesday I said that it appeared that an inverted corrective wave had completed at 1684.94, and that it was likely that the market would move higher. Move higher it did, as the SPX gapped higher at Thursday’s open, and continued to rise until hitting 1707.85, finally clearing the 1700 level. On Friday the SPX moved lower to begin the day, dropping to 1700.68 before rebounding to reach a new all-time high at 1709.36. 


This morning the index opened lower, falling to 1703.55. Again the SPX rebounded, but today it failed to reach a new high, falling short at 1709.04. The index then dropped to 1704, and then bounced back to 1707.83 before the close.

Since the opening minutes on Thursday, when the SPX spiked above 1702, the SPX has traded in a narrow 9 point range between 1700, and 1709. The most prominent features of this range bound trading have been the 7 point drop at Friday’s open, and this morning’s 6 point drop to open the day. Since the inverted corrective wave ended at 1684.94, my count has a 5 wave sequence completing at 1707.85, another at 1700.68, a third at 1709.36, and a fourth at 1703.55. From 1703.55, the SPX has completed 3 sequences at 1709.24, 1704.32, and today’s close at 1707.24.

For the near term, it appears the SPX is forming another inverted corrective wave from 1707.85. This would complete at 1703. If 1703 holds, the SPX should rally, with 1718 being the likely target. I still see this rally eventually carrying the index to a minimum of 1776.