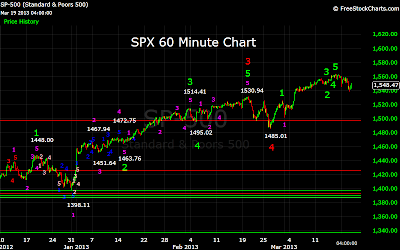
Saturday, March 30, 2013

Weekend Outlook 03/30/2013


Last weekend I updated my count indicating that the market had now completed Wave 2 from 666.79 at 1538.57, which turned out to be an inverted corrective wave, and leaving open the possibility that the market had also completed Waves 3, 4, and 5 from the 666.79 low. This week the Wave 2 low was confirmed, and the fact that we are still in Wave 3 became clear.

Although my model is based on wave counts, I will once again point out that it is not Elliot Wave Theory. If you are looking at my counts from an EW perspective they will look odd, but they are based on mathematical relationships between waves. There have been a lot questions concerning my model, and up to this point I have been reluctant to go into specifics. There are several reasons for this, some obvious, some not so obvious. However, I feel the time has come to share at least the basics of my model. Some of this is for the sake of credibility; some is based on the fact that in order to advance my theory I need a certain amount of feedback, both positive and negative. The scientific method if you will.

 
The 5 Wave Model is based on a surprisingly simple principle. That is, in a given 5 Wave sequence, waves 1, 3, and 5 share a certain proportionality. The endpoints of these waves are highly dependent on their starting points. Throughout this post, I will point out this relationship through examples.
I will start today with my long term count from 666.79. As I have stated previously, the market is now in my Wave 3 from that point. Wave 1 terminated at 1370.58, with the 5 waves breaking down as 666.79-956.23-869.32-1219.80-1010.91-1370.58. If you plot these waves as points, (666.79, 956.23), (869.32, 1219.80), (1010.91, 1370.58), you will find they have a correlation coefficient of .997. I use certain threshold correlation values to determine wave end points.
Wave 2 began at 1370.58, and terminated at 1538.57. It was an extremely complex wave, and what I call an “inverted corrective wave”. This wave broke down as 1370.58-1074.77-1555.74-1562.86-1538.57. These points have a correlation coefficient of .994.
 
With Wave 2 ending at 1538.57, the market is now in Wave 3. This wave appears to be forming a rather complex wave. Several 5 Wave sequences have completed, but those 5 Wave sequences have not yet completed a subsequent 5 Wave sequence. I have identified 5 Wave sequences from 1538.57-1561.56, 1561.56-1545.90, 1545.90-1564.91, 1564.91-1546.22, 1546.22-1563.95, 1563.95-1551.90, and 1551.90-1570.28. My interpretation is that the first four sequences identified can be Waves 1, 2, 3, and Wave 1 of an inverted corrective wave, or a series of 1’s followed by Wave 1 of an inverted corrective wave. This is what I call a nested inverted corrective wave. Both of these interpretations imply higher prices. One other possibility is a Wave 1, followed by Waves 1, 2, and 3 of an inverted corrective wave The next three sequences appear to be Waves 1, 2, and 3 of a lesser degree wave. I have identified the first four sequences with an “X” on the 15 Minute chart.
In order for the wave from 1538.57 to complete, we must first see Waves 4 and 5 from 1546.22, followed by a minimum of one more move higher, depending on how the other waves resolve. Wave 4 should terminate at 1563.50, or 1557.40, which then gives a Wave 5 projection of 1576.40, or 1583.20. Using several other relationships, 1557 for Wave 4, and 1576 for Wave 5 seem to be the best fit.
Once Wave 5 is completed, the market should move lower. I would expect this correction to terminate at either 1554, or 1547. Those prices would fit the possible patterns I alluded to previously. This move lower should give us a better idea of the Wave degree of the first four sequences from 1538.57.


Friday, March 29, 2013

Thursday's Market 03/28/2013


The SPX opened higher today, reaching 1565.09, falling just short of my 1565.50 upper limit that would end this move from 1538.57. That limit was derived from the highest price that would complete a 5 Wave sequence from the aforementioned low, given the pattern of 5 Wave sequences completed thus far. A move above that point would signal a different wave structure was underway, and a structure indicating higher prices was forming. After pulling back to 1561.08, the market once again moved higher, this time surpassing my 1565.50 limit, and continuing on to 1568.30. Another pullback followed, this time taking the index to 1564.42, before the market rose for a final time. This rise was more sustained, and topped out at 1570.28 just before the close.

 
I indicated yesterday that I had expected a lower opening, which was based on the market having completed a 5 Wave sequence at 1567.04. The dip yesterday from that high, the higher open today, and the first decline this morning to 1561.08 formed a semi-inverted corrective wave from that high. From 1561.08 the market traced out a 5 Wave sequence to 1568.30, which included an inverted corrective wave. Following the 5 Wave sequence decline to 1564.42, the market formed one final 5 Wave sequence to the day’s high of 1570.28.
 
Looking at the 15 Minute chart, the larger formation from the 1538.57 low is becoming clearer. It is now evident that the market is still in Wave 3 from the 667 low. The next possible 5 Wave sequence that may form is from the 1546.22 low. It appears that 3 Waves have formed up to the 1570.28 high, leaving Waves 4, and 5. From 1570 we are likely to see a pullback to 1557, a rise to 1574, followed by another pullback to 1548.
I will elaborate on this count over the weekend.
Thank you.


Wednesday, March 27, 2013

Wednesday's Market 03/27/2013


The more things change, the more they remain the same. After starting the trading session to the downside as anticipated, the market quickly turned around. By the end of the session, the market had pushed slightly into positive territory, and finished within a point of yesterday’s close.

 
The market opened to the downside, falling below 1552 to 1551.90, which proved to be the low of the day. The next several hours saw the market gain back nearly ten points, rising to 1561.19. After a pullback to just below 1558, the market rallied the rest of the day; edging out yesterday’s high before pulling back into the close.
The market completed a 5 Wave sequence from the low of the day to the high, indicating the market may move lower at the outset tomorrow morning. However, the market is just as likely to rise off that low as it did today.
While my bias is still for this market to move lower, I am still looking at a break above 1565.50 as an indication that the market will move higher. A drop below 1545.90 will confirm a breakout to the downside.
Thank you for your interest and support.


Tuesday, March 26, 2013

Tuesday's Market 03/26/2013


Although the market enjoyed a strong move higher today, nothing in that move changed my current view of the wave count I have been talking about since this weekend. That count has Wave 1 from 666.79 terminating at 1370.58. Wave 2 turned out to be a rather lengthy inverted corrective wave that eventually ended last Tuesday at 1538.57. From there I have Waves 3, 4, and 5 terminating at 1561.56, 1543.55, and 1564.91 respectively.

 
The market jumped this morning above 1558 in the opening minutes of trading. The action became a bit choppier from that point, with the SPX hitting 1561.59 before pulling back. That pullback took the market to 1556.45. The market then traded within that range over the next several hours before hitting a new high for the day. The SPX eventually made it to 1563.95, and closed just off that high.
This entire move was the completion of a single 5 Wave sequence from yesterday’s 1546.22 low. Wave 1 ended yesterday at 1555.59, with Wave 2 an inverted corrective wave that completed today at 1556.45. Wave 2 of this wave was also an inverted corrective wave, of which this morning’s spike higher was the main feature. Waves 3, 4, and 5 then completed, with Wave 5 carrying the market to 1560.77. This then became Wave 1 of a higher degree wave. Wave 2 was again an inverted corrective wave, and Wave 5 completed at 1562.95.
With a 5 Wave sequence from 1546.22 now completed, and the market still below yesterday’s high, now would be the time for the market to move lower. I am still looking for a move below 1545.90 to confirm 1564.91 as the completion of Wave 5 from 666.79.
There are several alternatives for the market. If the market manages to make a slightly higher high, it would complete a 5 Wave sequence from 1538.83 Wave 2 low. This would imply that only Wave 3 has completed. A pullback for Wave 4 would be expected, and then at least one more move higher for Wave 5.
If the market breaks through the 1565.5, it would mean that Wave 3 still has further to go. This would then be followed by Waves 4, and 5.  
Thank you. Your interest, support, and comments are much appreciated.


Monday, March 25, 2013

Monday's Market 03/25/2013


With today’s move to a new uptrend high at 1564.91, my count from this weekend seems to be confirmed. That count had 1563.62 completing a 5 Wave sequence from 1074.77. This in turn completed Wave 2 of an inverted corrective Wave 2 from the May 2011 high of 1370.58. Wave 3 then completed at 1555.74, Wave 4 at 1562.86, and Wave 5 at 1538.57. This concluded Wave 2 from 666.79.
From that point, the market completed a 5 wave up to 1561.56, a 5 wave sequence down to 1545.90, and a 5 wave sequence today at 1564.91. That very well could complete Wave 5 from 666.79. This would be confirmed with a move below 1545.90. Since we stayed above that level today, it is still possible for the market to move higher, and also possible that we are still in Wave 3 from 666.79.


After a flat start this morning, the market powered higher, moving to 1564.91. This completed a 5 wave sequence from the 1545.90 low. After hitting the new uptrend high, the market sold off rather quickly, dropping below the previous close, and hitting 1550.68 before trying to move higher. After a small rebound, the market fell again, this time to 1546.22. At that point the market did rally, moving past 1555, and turning positive for the day once again. After falling back to 1548, the market rallied into the close.
 
If the market moves higher from here, 1565, just marginally higher than today’s high, would be my target. If the SPX should hit that level, the implication would be that we are still in Wave 3 from 667.


Saturday, March 23, 2013

Weekend Outlook 03/23/2013


In Friday’s post I touched on the possibility that the market completed a 5 Wave sequence from the 1074.77 low, followed by the completion of an inverted corrective wave from 1370.58. Today I will also suggest that the market may have also completed a 5 Wave sequence from 666.79. This does not mean that I am suggesting the market will undergo a severe correction, but it is possible that we will see a significant correction.

I will start with the wave from 1074.77. Wave 1 carried the market to 1292.66, with Wave 2 ending at 1158.66. Wave 3 proved a little more complex, featuring an inverted corrective wave, and terminating at 1422.38. Following that high, the market dropped to 1266.74, completing Wave 4. Wave 5 has been the most complex of all. Wave 1 of 5 formed as a nested inverted corrective wave. Notice the cluster of Wave 1’s near the beginning, and the cluster of 3, 4, 5 Waves near the top at 1470.96, as the wave unwound. Wave 2 of 5 was an inverted corrective wave that ended at 1485.01. Normally wave 4 is the high (or low) point of an inverted corrective wave. Notice that here, Wave 2 proved to be the high. With Wave 2 of 5 completed, Waves 3, 4, and 5 completed shortly thereafter.
 
 
Since September I have been calling for this wave to terminate above 1560. The high of this wave turned out to be 1563.62.
 
 If you look at the Weekly chart, you will see a 5 Wave sequence from 666.79 completed at 1370.58, followed by a correction to 1074.77. With another 5 Wave sequence now completed from 1074.77, the market either completed Wave 3 from 666.79, or Wave 2 of an inverted corrective wave from 1370.58. What occurred from 1563.62 was a 5 Wave sequence down to 1555.74, followed by a 5 Wave sequence up to 1562.86, and then another 5 Wave sequence down to 1538.57. My model is based on mathematical relationships between waves, and the sequence 1370.58-1074.77-1563.62-1555.74-1562.86-1538.57 satisfies my model requirements for an inverted corrective wave. Recall earlier when I cited an example of an inverted corrective wave in which Wave 2 was the high point.

So now my model has been satisfied for Wave 1 from 666.79 at 1370.58, and Wave 2 at 1538.57. What would be expected now are Waves 3, 4, and 5 to complete the sequence. From the 1538.57 low the market completed a 5 Wave sequence at 1561.56. A 5 Wave sequence then formed to the downside at 1543.55. A third 5 Wave sequence then completed at 1557.74. Based on the previous wave structure 666.79-1370.58-1538.57-1561.56-1543.55-1557.74 again satisfies my model for a 5 Wave sequence. This count remains intact as long as the market does not exceed 1587. Put another way, this market has topped unless it can clear 1587.
If we compare several waves, I think I can demonstrate that this is a real possibility. First look at the wave from 1266 to 1563. The waves in red are the largest degree waves. Notice red Wave 1 is comparatively large, with blue Wave 1 (Wave 1 of the inverted corrective wave) proportional to red Wave 1. Wave 2 of that inverted corrective wave was nearly the same length as red Wave 1. After that the remaining waves completed within a much shorter time frame.
 
Compare the previous wave to this one. As you can see the structure is very similar, with the wave culminating with a series of waves completing in quick succession.
 
Now look at the wave from 666.79. I am sorry the waves at the end are a bit hard to decipher, but hopefully you get the idea.
 
If the market can move above 1587 while staying above 1545.90, it would be most likely that Wave 2 from 666.79 has completed, and the market should move significantly higher as it completes Waves 3, 4, and 5.
If the market falls below 1545.90, before moving above 1587, it is most likely that the market has completed a 5 Wave sequence from 666.79. While the wave configuration makes it difficult to be too precise about the severity of the ensuing correction, the lower limit of the first support area would be around 1440.
Even if a 5 Wave sequence has completed from 666.79, the outlook is not entirely bleak. Waves can take many forms, and I will be watching this one closely. Thank you for your interest.


Friday, March 22, 2013

Friday's Market 03/22/2013


To say that the market is at an inflection point may prove to be an immense understatement in the coming days. While most, including myself, have been focusing on whether the market will move up or down a few points to signal the short-term direction, a move of much greater magnitude may be forthcoming. It is possible, indeed probable, that the market completed a 5 Wave sequence from 1074.77 last Friday at 1562.63, AND a 5 Wave inverted corrective Wave 2 from 1370.58 on Tuesday at 1538.57. Perhaps the equilibrium the market has experienced recently has been the result of these two large magnitude waves completing within a short time period, and within a tight point range. At the very least the market has put in a 5 Wave sequence top from 1074.77, with the implication of a fairly large move in whichever direction this market breaks out.
 
The market continued the rally from yesterday afternoon right from the open. The market reached 1552.88 near the open before the first slight pullback. This was right at the 1553 resistance level I mentioned yesterday. The resistance proved short-lived, as the market quickly broke through and rose to 1557.74 by early afternoon. After pulling back to 1553, the market rose again into the close.
The pullback from 1561.56 was a 5 Wave sequence that included an inverted corrective wave. The termination point of that 5 Wave sequence turned out to be 1545.90, higher than the actual low of the wave possible because of that inverted corrective wave. The failure for the wave to complete at the low may give an indication that this market wants to move higher.
 
 
I am still looking for a break above 1563.62 to confirm a breakout to the upside, and a move below 1538.57 to signal a break to the downside. I will elaborate more fully over the weekend.
 

Thursday, March 21, 2013

Thursday's Market 03/21/2013


With the action of today’s market, I was quite prepared to throw in the towel on my “1538.57 will prove to be the low of this correction” statement. However, after reviewing my charts this evening, I will hold onto my towel for at least one more day. Although there is a very real possibility that the SPX will fall below that low, it is also a very real possibility that it will not. The rub is that in the medium term, taking out that low would be the more bullish scenario.
 
The market dropped at the open, falling below 1551, and remained lower throughout the day. After attempting to rally following the opening drop, the market fell further to 1548.41. A more sustained rally ensued, but after briefing rising above 1555, the market started another leg lower. It finally found a bottom at 1543.55, and rose above 1550 before falling into the close.
After yesterday’s high of 1561.56, the SPX formed a 5 Wave sequence into the 1548.41 low. The SPX then formed 3 additional 5 Wave sequences, one into the 1555.31 high, another into the low of the day at 1543.55, and then one more into 1550.79 high shortly before the close. With only 4 sequences discernible from the 1561.56 high, I do not believe that a full wave has completed from that point.
Several options are possible at this point, and I will start with the one that keeps intact Tuesday’s 1538.57 low. This is also the simplest resolution, and assumes that an inverted corrective wave completed at the aforementioned low, and that 4 Waves have completed from the 1561.56 high. The target for Wave 5 would be 1538-1540, and allows for the low to remain intact. If that low holds, we should see one more rally that probably will not exceed 1572. As I mentioned above, this would also be a medium term bearish scenario, as it would likely mean a 5 Wave sequence from 1074.77 has completed and Wave 3 from 666.79. A rather steep correction would be anticipated.
The alternate scenario assumes that 4 waves have unfolded from the 1563.62 high, with Wave 5 underway.  The target for Wave 5 would be 1495-1518. This could play out in several ways. If the market opens higher, I would expect resistance at 1553. This would complete an inverted corrective wave from the 1548.41 low, and would indicate waves 3, 4, and 5 to the downside are yet to come. It is also possible that the market completes a 5 Wave sequence from 1561.56 at 1538-1540, and then starts a larger degree sequence into the 1495-1518 target area. This scenario would allow for a much higher upside target.
 
 
If the market opens lower, look for support at 1538-1540. If the previous low of 1538.57 holds, look for one more rally up to 1572. If that low does not hold, look for a move to 1495-1518. If the market opens higher, look for resistance at 1553, and then a move down to 1495-1518.
 

Wednesday, March 20, 2013

Wednesday's Market 03/20/2013


Although the market action today was not exactly as forecast, it does appear that 1538.57 will prove to be the low of this corrective phase, and the market is now poised to continue higher. There is a chance that this market has not bottomed, and if this is the case it will move substantially lower, possibly to 1520. The more likely scenario is that the market completed an inverted corrective wave from the 10/05/12 1470.96 high yesterday at 1358.57. That should complete Wave 2 from the 1266.74 low, with Waves 3, 4, and 5 pushing the SPX higher.
 
The market opened higher this morning as expected, but the magnitude of the rise was larger than anticipated. When the market moved above 1557, it became clear that the scenario I alluded to yesterday would not play out. It now looks like the SPX completed a 5 wave sequence from the 1538.57 low yesterday at 1550.46. The market then formed an inverted corrective Wave 2 from that point, which catapulted the SPX to 1559 within the first fifteen minutes of trading. Wave 2 completed at 1555.23, with the market then tracing out the remaining waves, and completing a 5 Wave sequence near the close at 1561.56.
 
I had been anticipating the corrective sequence from 1563.62 to complete an inverted corrective wave from 1470.96, but my interpretation was that 4 waves had completed, with only Wave 5 left. This interpretation would require a 5 wave sequence from 1563.62. As of yesterday I counted 3 waves completed, and anticipated a move up for Wave 4 and one final move down for Wave 5, which would have completed the sequence.
It now appears that 1563.62 marked the end of Wave 2 of the inverted corrective sequence from 1470.96, and the 3 waves from that high were waves 3, 4, and 5. With the corrective sequence now complete, the market should be ready to move higher.


Tuesday, March 19, 2013

Tuesday's Market 03/19/2013


 The market opened to the upside this morning, rising above 1557 before falling back to 1550. After a short-lived rebound, the market broke through yesterday’s 1545 low, and fell to 1538.57 with only one feeble attempt at moving higher. After that, the market staged a pretty good rally, moving above 1550 once again. A pullback followed, with the market turning higher into the close.

Yesterday I called for the market to open slightly lower before moving up to 1558, with a test of the 1545 low to follow. I was wrong about the lower opening, with the explanation coming shortly, but the market then acted as expected.
 
As for the explanation, I will break down the current wave from Friday’s 1563.62 high. The move from that point to 1555.74 formed Wave 1 of the current wave. The SPX moved to 1562.86 after that, which I interpret as Wave 1 of an inverted corrective Wave 2 from 1563.62. The market completed another 5 Wave sequence at 1557.29, which is Wave 1 of a sequence one degree smaller than the 1563.62-1555.74 wave. The bounce to 1560.70 is where I went wrong. Yesterday I interpreted that as Wave 1 of a second inverted corrective Wave 2. This is a set-up I refer to as a nested inverted corrective wave. It was under this assumption that I gave my forecast as I did. Today’s action made it clear that the bounce to 1560.70 was the completion of Wave 2 for that sequence that completed today as 1562.86-1557.29-1560.70-1545.13-1558.73-1538.57. This sequence then completed Wave 2 of the inverted corrective wave from 1555.74.
The market should now be in Wave 3 of that inverted corrective wave. From the low of 1538.57 I see wave 1, an inverted corrective wave 2, wave 3, and what appears to be wave 4, which concluded shortly before today’s close. T o complete the inverted corrective wave 2 from 1555.74, the market should move higher to 1554, pullback 1545, and then move higher to 1557. The market would then need to complete waves 3, 4, and 5 to complete the wave from 1563.62. I still look for 1535 to be the downside limit of this correction. It is possible that we have seen the low of this wave. With the low of 1538.57 being part of an inverted corrective wave, Wave 5 of the sequence could very well terminate above that level.
 
 
This scenario also fits in well with a timing model I have been developing. This timing model called for the end of this corrective wave to terminate late Wednesday afternoon. If the market should move higher at the open, and then fall to 1545 in the morning, the final move to 1557 mentioned above could occur in a couple of hours. With the FOMC concluding its meeting tomorrow afternoon, there would be enough time to complete Waves 3, 4, and 5 to the downside. The FOMC statement could then provide the impetus for the next move higher, or the final push lower if it has not already completed.
I have been a little long winded, so I will wrap this up here. The market should move higher tomorrow morning, first to 1554, and then 1557. This should be followed by a test of today’s 1538.57 low, which should hold above 1535. That will then complete the wave from 1563.62, and the inverted corrective wave from 1470.96, clearing the way for the market to move higher, to above 1608.


Monday, March 18, 2013

Monday's Market 03/18/2013


The market started the day with a sharp sell-off, with the market dropping to 1545.13 within the first few minutes of trading. By midday the SPX had recovered to 1558 before the sellers came back. After falling to 1554, the market once again moved higher, this time to nearly 1559. At this point the sellers once again stepped up, and took the market down to 1550 shortly before the close.
 
This market has been quite interesting and quite difficult for some time. Of course that is half the fun. It now appears the market completed a 5 Wave sequence from 1485.01 last Friday at 1563.62. Since then the market seems to be forming a nested inverted corrective wave from that point. If this interpretation is correct, the bias of the market for the next several days should be down, but should also be quite choppy.
Near term, I expect a lower open tomorrow, back near 1550. After that the market should rise to 1559, before testing today’s 1545 low.
 
For the medium term, the market is now in Wave 5 of an inverted corrective wave from 1470.96. This count can be seen on the Daily chart. If this count is correct, I would expect this correction to conclude above 1535.  From there I expect the market to move higher, with my next target still above 1608.
 
It is interesting to compare the current inverted corrective wave from 1470.96 on the Daily chart to the one that formed on the Hourly chart between 1448.00 and 1463.76. This would be between waves 1 and 2 in green on the Hourly chart. It is also interesting to not what happened at the conclusion of that wave. Time will tell if we see the same thing.


Sunday, March 17, 2013

Weekend Outlook 03/17/2013


Again, I apologize for having been away for some time.

In my Weekend Outlook of September 9th, I said the current wave from the March 2009 low of 666.79 should terminate somewhere above 1560. With that milestone having been achieved this past week, I thought it an appropriate time to try to resume my blog.

Since it has been some time since I posted, and I have updated some of my counts, I will start with the longer term outlook, and work my way down from there. On the weekly chart you can view my count from the 667 low. It is now most likely that a 5 Wave sequence completed at 1370.58. The breakdown for this count would be 666.79-956.23-869.32-1219.80-1010.91-1370.58. The market corrected to 1074.77 from that high, before resuming the uptrend. So far the market has completed two impulsive 5 Wave sequences to the upside from that point, with two intervening corrective sequences. The third sequence to the upside is now unfolding. The target for this wave would be 1608-1664.
 
If we look at the wave structure from the 667 low to 1371, we can see that it was a simple 5 Wave structure, with no complex corrective waves. This would imply that 1370 is Wave 1 of another simple 5 Wave structure higher, with wave 3 shorter than wave 1, and wave 5 shorter than wave 3. A move to 1608-1701 would then complete Wave 3 from 667, and I would expect Wave 4 to follow. This would then require a fairly severe correction, perhaps to 1200-1250, before the uptrend resumes, with an ultimate target of 1688. The 5 Wave sequence from 667 would then be 666.79-1370.58-1074.77-1608-1212-1688.
 
On the Daily chart we can see the progress of the wave from the 1074.77 low. The market has complete 4 waves thus far, with Wave 5 sub-dividing. So far the sequence is 1074.77-1292.66-1158.66-1422.38-1266.74, with a Wave 5 target of 1540-1664. The sub-dividing Wave has also completed 4 waves, 1266.74-1470.96-1343.35-1530.94-1485.01, with a Wave 5 target of 1608-1701. Combining these two targets gives us the 1608-1664 target for Wave 3 from 667.
 
In the near term, the market only needs to complete a 5 Wave sequence from 1485.01 between 1608 and 1664 to complete Wave 3 from 667. This wave has been quite complex, and has two possible course at the moment. The sequence could move higher straight to 1608-1664, or we could see a short term top at 1565. From there I would anticipate a pullback before the resumption to above 1608. The first support level is 1554, and then 1528-1535.
 
If the market clears 1565, the market should move above 1608, with a substantial correction to follow, possibly to 1200-1250. If the market encounters resistance at 1565, and falls below the 1554 support, it could move to 1528-1535 before rising above 1608.