Saturday, August 25, 2012

Friday's Market 08/25/12


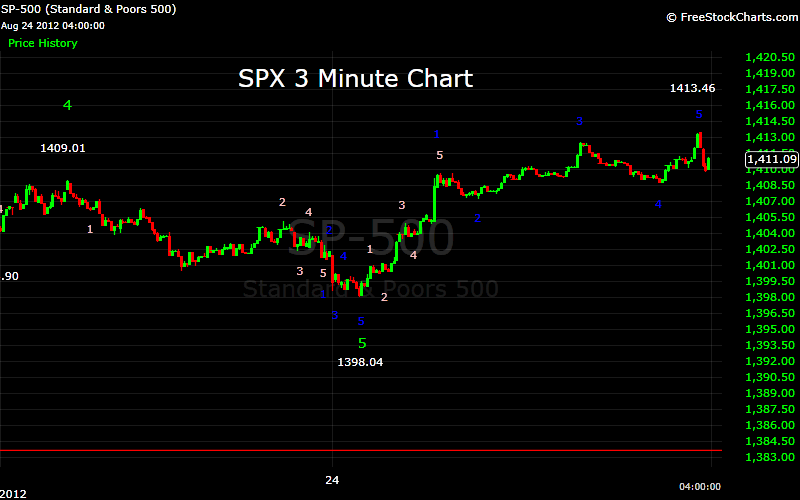
The market opened lower today, spiking below 1399, before recovering slightly to 1400. After that the market drifted slightly lower, bottoming at 1398.04. The market then rallied off that low, initially to 1401, and eventually carrying the market back near 1410 by late morning. After a small pullback to 1407, the rally continued. A move above 1412 was followed by a pullback to 1409, and then a final push to 1413. At that point the market fell rather quickly to 1410, before moving higher into the close.
 
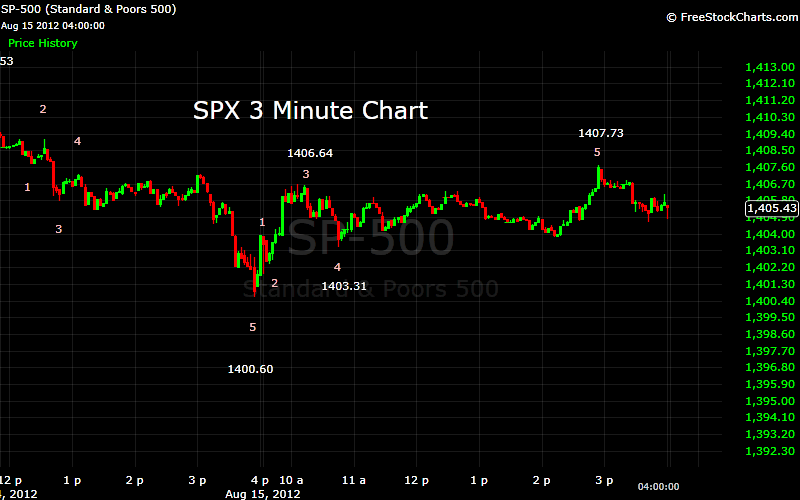
Yesterday I mentioned the possibility of the market moving slightly lower this morning, but contended that it should hold above 1395. From there I expected the market to rally. The market completed a 5 wave sequence this morning from the 1426 high. Wave 1 of this sequence completed yesterday, with the small rebound into Thursday’s close serving as wave 2. The spike lower this morning was wave 3, the slight rebound wave 4, and the final drift lower to 1398 completed wave 5, holding above the 1395 level I had mentioned.
The rally off that low began with a 5 wave sequence completing at 1410. This wave featured a series of expanding wavelengths, indicating a further move higher. After a small pullback this rally continued, forming another 5 wave sequence that completed at 1413. This last series of waves were decreasing in length, indicating either the end of the move, or at the very least, a loss of momentum that will result in the end of the move coming soon.
 
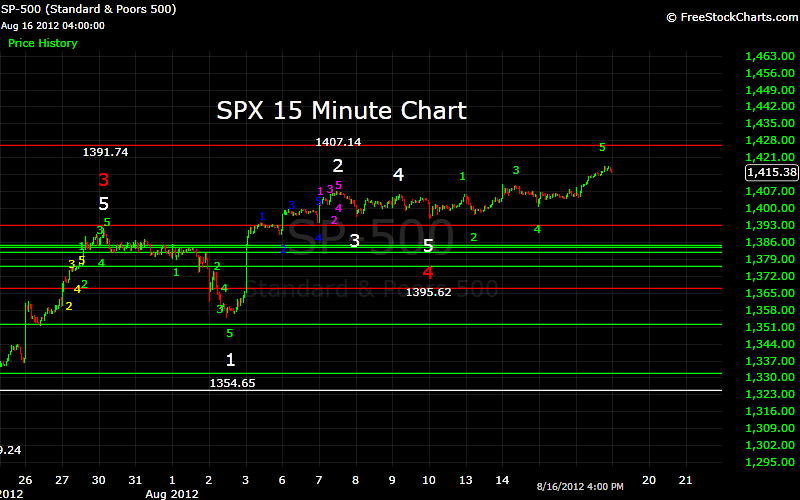
Today’s low most likely completed wave 4 from 1267, now putting us in wave 5. With this wave in the target zone for wave 5, and the aforementioned decreasing wavelengths, makes it very likely that the move from 1267has completed. A move below 1395 should confirm this, with a further correction most probable. I have been operating under the assumption that this is wave 3 from the 667 low, but the fact that the current move rose above the previous 1422 high, and yet the 5 wave sequence completed below that high, buts that assumption in doubt. One possible scenario is that the move down to 1267, and then back up to 1426, was waves 1, and 2, of a complex correction from the previous 1422 high. I will cover this possibility, and the others, over the weekend.


Friday, August 24, 2012

Thursday's Market 08/23/12


The market opened lower today, falling quickly to 1407. After a slight rebound from that level, the market headed even lower, and reached 1404 before trying to rally. That rally only carried back to 1409, and then the selling resumed. This move took the market to 1400.50, and was followed by another rebound to 1405. One final move lower into the close, took the market back down to 1401.57.
 
Today’s initial move lower to 1403.90, completed a 5 wave sequence from Wednesday afternoon’s 1416 high. After the rebound to 1409, the market completed another 5 wave sequence to 1401.57.
 
Today’s waves also seem to complete a 5 wave sequence from the 1426.68 high, while staying above the 1395 minimum target, which means this is most likely still wave 4 from 1267. The market could still move slightly lower, completing another 5 wave sequence while staying above 1395, but I think the market is now poised for wave 5 up over the next several days. This could carry above the 1426.68 uptrend high.
 
 If the SPX breaks below 1395, we could be headed significantly lower. Support is at 1387-1397, 1376, and 1367. Resistance is at 1426.

Wednesday, August 22, 2012

Wednesday's Market 08/22/12


The market opened slightly lower, and soon the selling accelerated bringing the SPX down to 1408.51 after a few minutes of trading. The market then moved higher, rallying back to 1413. The market sold off again, this time falling to 1408. After another rally to 1410, the market fell to the low of the day at 1406.78. The market then rallied in stair step fashion through the afternoon, first to 1408, then 1410, followed by 1413, until reaching the high of the day at 1416. The market then fell slightly, back to 1413 near the close.
 
Yesterday the market completed a 5 wave sequence to the downside after hitting a new uptrend high at 1426.68. This morning the market completed another sequence from 1427, forming a contracting wavelength sequence. As I have noted in the past, this is generally a signal of a strong move in the opposite direction, and this was no exception, with the market rallying just less than ten points from the low. This rally unfolded in a 5 wave sequence, which terminated at 1416.12.
 
Today’s low of 1406.78 seems to complete wave 5 of the inverted corrective wave 4 from 1267. We should now be in wave 5 from that low. The rally to 1416 satisfies my model for wave 5, which fits the failed wave 5 scenario I mentioned yesterday. The upside limit for this wave could still carry the SPX higher from here, most probably taking out the 1426 uptrend high, and possibly higher. I do not see this wave making it up to my next target level of 1497.
 
Once wave 5 has completed, we can start looking at the downside potential for the corrective wave. As I see this as the completion of wave 3 from 1267, there are still possibilities for the market to continue higher. Wave 2 of this sequence was not a complex corrective wave, so the odds favor wave 4 being complex. This could mean an inverted corrective wave, which would only require a minor correction. I will discuss this further as the wave develops.


Tuesday, August 21, 2012

Tuesday's Market 08/21/12


This morning we saw the breakout to the upside I had talked about yesterday. After a few minutes of trading, the SPX had reached nearly 1423, finally surpassing the previous high from 667 of 1422.38. The market continued higher, reaching 1426.68 by mid-morning. That would be the high for the day, as the market underwent the steepest sell-off it has seen for awhile. With only a few pauses, the SPX fell to 1410.96, before moving higher into the close.


The action today was interesting, and possibly very significant. For quite some time, I have been targeting two possible levels for the termination of the 5 wave sequence from 1267; 1426 and 1497. The wave structure recently has been less than convincing for a major push higher to 1497, although up until today, the market had managed to avoid putting itself in a position to top at 1426. In fact, the DJIA may already have topped.

I have been looking for alternate scenarios for a couple of weeks. The DJIA has been in a topping formation, but the SPX seemed to be trying to avoid a top here, and move ahead to 1497. With the market hitting 1426 today, a level I have been looking at almost since the market bottomed at 1267, and the subsequent sell-off from there, makes it time to seriously consider the market forming a top very soon.
Today, I will start with the DJIA. Some of you may remember that when the SPX was at 1267, and there was some degree of uncertainty as to future direction, I used the wave structure of the DJIA to make my case for the market moving higher.

On June 4th, the DJIA bottomed at 12035.16. That index completed a 5 wave sequence at 12961.30. This can be broken down into sub-waves as 12035.16-12649.86-12398.16-12898.86-12450.40-12961.30. Wave 2 was an inverted corrective wave with the structure 12961.30-12492.33-12977.57-12521.88-13117.70-12780.42. Wave 3 of this sequence carried the market to 13215.90, and wave 4 completed at 13095.18. Today’s move to 13330.68 satisfies my model for the completion of a 5 wave sequence.

I have posted an alternate scenario on the SPX 60 Minute chart that would put us at a top. The count is slightly different than the DJIA count, but the result would be the same. This count has waves 1-3 from 1267 terminating at 1335.52, 1306.62, and 1363.46, respectively. Wave 4 was then the complex corrective wave, with 4 waves being completed. Wave 4 of this wave terminated today at 1426.68. Wave 5 is underway now, which would complete wave 4, and should then be followed by wave 5 higher. If the corrective wave 4 terminated at today’s low of 1410.96, I would expect wave 5 to end around 1429, only slightly higher than today’s high. If this corrective wave moves lower, it is possible wave 5 would be a failed wave, which means it would not surpass the 1426 high of today.
The SPX has formed some very complex waves during this advance, and it is possible that it has completed a 5 wave sequence from 1267, as the DJIA has. This corrective wave 4 could carry as low as 1395, and still keep this scenario intact. If the market moves below that level, it is likely the wave 5 top occurred at 1426. If wave 4 carries down near 1395, the failed wave 5 may only make it back to 1406.
I see this as the completion, or near completion, of wave 3 from the 667 lows. Given the wave structure thus far, wave 5 may only make it slightly above todays high.


Monday, August 20, 2012

Monday's Market 08/20/12


The market started the day moving slightly lower from Friday’s close, dropping below 1415, before rebounding to 1417. The selling continued after that bringing the market down to 1412. The market tried to move higher through the rest of the morning, and into the early afternoon. After making it back up to 1417, the market fell back once again to 1415. The market then rallied to 1418, before falling once again to 1416. The market again tried to rally into the close, making it back to 1418.

Today’s drop from Friday’s late afternoon high of 1418.71, to 1412.12, unfolded in a 5 wave sequence. From that low, it appears the market began a 5 wave sequence to the upside, with wave 1 terminating at 1413.31. Wave 2 played out as an inverted corrective wave, which terminated at 1414.73. It appears the market then completed waves 3, and 4 of that sequence. Wave 5 of this sequence should terminate at 1420-1421.

It now looks like Friday afternoon’s 1418.71 high completed a 5 wave sequence from 1395. This morning we saw a 5 wave corrective sequence, and we should now be ready to move higher. As I mentioned above, the market should complete a sequence at 1421-1421, with my next target at 1430-1441.
Near term support should be at 1411, 1407, and 1402.


Friday, August 17, 2012

Thursday's Market 08/16/12


A higher opening this morning lifted the market to 1408.65. From there, the market moved lower, dropping to 1404, before starting a prolonged rally that lasted into late afternoon. Once it broke back above 1408, the market continued on to 1410. After a minor pause, the rally resumed, moving the market to 1413, which was followed by another small pause. By late afternoon, the market stood at 1417.44. The market dropped back to 1414 near the close, before moving higher into the close.

Yesterday I said I was looking for the market to move initially to 1412, undergo a very slight pullback, and then continue on to 1418-1420. This was based on a 5 wave sequence from 1400.6 completing yesterday afternoon. That sequence actually ended this morning at the open, with wave 2 forming an inverted corrective wave, which carried the market to 1413.59, before the slight pullback to 1412.41. This altered the projection I gave yesterday slightly, but still very close. The 5 wave sequence from1400 then ended at today’s high of 1417.44. A 5 wave sequence to the downside from there has completed.

This now completes a 5 wave sequence from 1395.62, which I see as wave 1 of wave 5 from 1267. Having finally broken out of the narrow trading range it had been in, it now seems likely that wave 5 from 1267 will carry to 1497.
The next short term upside targets are 1421-1423, and 1427-1435. I have said before that the next move could be fairly swift, meaning the pullbacks could be minor. With that in mind, a 5 wave sequence completed today from 1417.44 to 1414.36, which also reached a support level based on the 1395-1417 sub-waves. The market could very well move higher from here.
Support for the corrective wave from 1417 should be 1414, 1411, 1407, 1402, and 1399.

Wednesday, August 15, 2012

Wednesday's Market 08/15/12


It was another seemingly lackluster day of trading. After rising yesterday from the 1400.60 wave 5 low, the market pulled back at the open today, falling to 1402. Then, what has passed for a rally the last several days ensued, carrying the market above 1406. The market then pulled back to 1403, before rising in choppy fashion back to 1406. Another pullback to 1404 was followed by another move higher to near 1408. From there the market moved lower once again to 1405 near the close.

This was another day spent in the narrow trading range the market has been in for almost two weeks since the move off the 1354.65 low. Although it has been a narrow range, it still appears to be forming in a bullish fashion. It still looks like 1391.74 was the wave 3 high from 1267. A complex corrective wave 4 followed, which ended at 1395.62. The wave structure from there is still incomplete, and could take several forms, but what I see right now has waves 1-4 completing at 1395.62-1405.98-1397.32-1410.03-1400.60. Today I believe we saw waves 1 and 2 of wave 5 from 1395.62. This should terminate near 1418-1420. This should be wave 1 of the sequence that may take the market to 1497.

I would look for the market to continue higher. The market should move to 1412, and after a very slight pullback, it should continue on to 1420. I continue to look at 1395.62 as the level that would put this scenario in jeopardy. If that level fails, the market could continue down to 1380.

Tuesday, August 14, 2012

Tuesday's Market 08/14/12


It was another opening gap to the upside this morning, with the market moving above 1410 early on. This was another new uptrend high, and it would also prove to be the high for the day. After dropping back to 1405, the market tried to rally once more, but this rally peaked at 1409.53. The market sold off for most of the rest of the day, with only a slight pause at 1405. This took the market back to 1400 before the market rallied back to near 1404 at the close.

In my weekend update I said I was looking for an initial move to 1410-1414. Although I was a day late, and the wave did not form exactly as I thought, that is the range the market hit today. I would say a 5 wave sequence terminated this morning at 1309.53, and then another sequence to the downside completed at 1400.60. I still see this as the beginning of wave 5 to the upside from 1267. If this plays out, the next target should be 1418-1420.

There is a possible count that makes today’s 1409.53 high the peak of a wave 5 from 1354.65. If this turns out to be the case, I would expect this corrective wave to terminate either near 1395, or 1385-1380. This would possibly change the projection of wave 5 from 1267 to 1426, instead of 1497.

Monday, August 13, 2012

Monday's Market 08/13/12


The market opened slightly higher today, but quickly dropped below 1402. A rally from that point took the market above 1405, but then was met with more selling. By late morning, the market found itself back below 1400, falling to 1397. The midday hours were spent moving steadily higher, and by late afternoon, the market was back near 1405. The market dropped back to 1402, before rallying into the close.

Again the market traded in a narrow range between the 1407, and 1397 support/resistance lines. This continued the trend from last week.
I had expected the market to break out of this range today, but obviously the market needed at least one more day. It now looks like the market completed a 5 wave sequence from last Friday’s low of 1395.62 this morning at 1405.98. A corrective sequence followed, completing at 1397.32. The rally into this afternoon completed another sequence to the upside, which took the market to 1404.65.

My analysis from this weekend remains, with my view being the market completed wave 4 from 1267 Friday at 1395.62. I feel the market will still break out to the upside, with my wave 5 target remaining at 1497. A break below 1395.62 at this point would invalidate this scenario, and likely mean the market would continue lower.


Saturday, August 11, 2012

Weekend Outlook 08/11/12

The market traded in a fairly narrow range this week, much less than the previous week’s range. Having closed out the week at 1391, the market opened higher on Monday, reaching a new uptrend high of 1399.63, before pulling back to 1394. Tuesday saw another strong opening, and another new uptrend high of 1407.14. By Wednesday morning the market had fallen back to 1396, and then staged a rally that lasted into Thursday, bringing the market back up to 1406. However, by Friday’s opening, the market had dropped once again to 1396. A move higher from there to 1402 was followed by another sell-off to 1397, and then a fairly strong rally into the close left the market at 1406 once again.

In last Weekend’s Update, I said 1391.74 was the termination point of wave 3 from 1267, with wave 4 possibly ending at 1354.65. I pointed out that this scenario gave a target for wave 5 of 1335-1375, slightly off from the 1426 or 1497 target I was looking for. During this past week I also commented on the fact that with the down waves consisting of waves of increasing lengths, and the up waves composed of waves of diminishing lengths, a move to the downside was possible, and that that down move may bring the current target back into line with the 1426 or 1497targets. Instead, it appears the market has formed a more complex corrective wave, which accomplished the same thing.

1391.74 looks like the termination point of wave 3 of the ongoing move from 1267. The initial move down to 1354.65 now appears to be wave 1 of a corrective wave 4 from 1391.74. Wave 2 of this wave carried the market to the new uptrend high of 1407.14. Wave 3 then completed on Wednesday at 1396, with the move back up to 1406 on Thursday completing wave 4. The ensuing move down to 1395.62 on Friday completed wave 5 of the corrective wave, and wave 4 from 1267.
This scenario projects wave 5 to complete above 1475, with 1497 remaining my target for this wave. If this scenario plays out, I would expect a move higher from Friday’s close, initially to the 1410-1414 level. This projection is based on the sub-wave structure from the partially completed wave from 1395.62. This would complete the first wave of wave 5 from 1267.

Friday, August 10, 2012

Thursday's Market 08/09/12

The market moved slightly lower at the outset of today’s trading, before moving higher, first to 1404, and then to 1405.95 after a small pullback. The SPX sold off from there, dropping below 1400, to 1398, before attempting to stage another rally. This rally fell just short of making it back to 1405, and another pullback took the market to 1402 near the close.

Yesterday I mentioned the 1405 level as important for today, and it turned out to be. The first rally to 1405.95 completed the 5 wave sequence from Wednesday’s 1396 low. Another 5 wave sequence completed as the market fell to 1398, and the rally back to 1404.69 also played out as a 5 wave sequence.

The market appears to be looking to stage a breakout in one direction or the other, but short term there are a few danger signs. Since the 1354.65 low last Thursday, the up sequences have been forming with waves of diminishing length, while the down sequences have displayed increasing wave lengths. This usually means the market will break out to the downside. If the market does break out to the downside, I would look for it to move down between 1390, and 1370. There is a cluster of support down to 1387, with support then moving to 1384, and 1376. Those would seem to be likely levels for the down move to terminate. A move to that area would likely mean a subsequent move to 1426 would complete a 5 wave sequence from 1267.
If the market breaks out to the upside, I still look for a move to between 1435, and 1475. That projection should narrow as the wave starts to complete.

Thursday, August 9, 2012

Wednesday's Market 08/08/12

I was looking for a move up from yesterday’s close, but the market started to the downside today, dropping to 1396.13 near the open. The market rallied from there, turning positive for the day, and moving up to 1404.14. That was as high as the market could get, turning lower after that, and pulling back to 1399.86. Another rally towards the close brought the market back near 1403, before fading slightly into the close.

The drop to 1396 at the open stayed within the parameters of the 5 wave sequence from Tuesday’s 1407 high, although it was slightly more than I had anticipated. This probably discounted the scenario I laid out yesterday, and bringing back into play the count I outlined on Monday. This results in a 5 wave sequence being completed from 1354.65 at 1407.14. A 5 wave sequence then completed at 1396.13, and possibly 4 waves of a sequence completing to the upside today. The target for this wave 5 is around 1405, below the uptrend high of 1407. A move above that would signal a resumption of the uptrend, with resistance at 1426.

It is possible that the market will move lower, below today’s 1396 low. This would most likely carry back down between 1390, and 1370. If the market does fall between those levels, one more move to the upside would still be required. The target for that would be 1426, or above, which puts us right back at the original 1426 target.

Tuesday, August 7, 2012

Tuesday's Market 08/07/12

As expected, the market opened higher today, moving quickly above 1400, and then to 1402. After a minor pullback, the market climbed to 1404, and then started to move lower. This pullback found support back near 1402. From that point, the rally continued this time taking the market to 1406. After another small pullback the market moved to the day’s high of 1407.14, which also marked a new uptrend high. The market then pulled back through the afternoon, bringing the market back near 1400 just before the close.

The move higher this morning was expected, but took the market slightly above the level I was looking for. This would seem to invalidate the count I was looking at. The market completed a 5 wave sequence from 1354.65 to 1394.16, a sequence from 1394.16 to 1388.69, which was then followed by a 5 wave sequence from 1388.69 to 1399.63. The move down from that high to yesterday afternoon’s 1393.82 low also completed a 5 wave sequence. Today the market completed a 5 wave sequence from that low to 1407.14, and another into this afternoon’s low.


The five 5 wave sequences from 1394.16 meet the criteria of an inverted corrective wave, which makes it most likely that wave 1 from 1354.65 terminated at 1394.16, which was then followed by a 5 wave corrective sequence that terminated this afternoon at 1400.85. This is best seen on the 15 minute chart. If this count proves to be correct, the market should now move higher into my next target of 1435-1475. This move could be fairly quick, with only very minor pullbacks along the way.

Support is at 1387-1397, and then 1376. Resistance is at 1406, and then 1426.


Monday, August 6, 2012

Monday's Market 08/06/12

The market opened higher today, and then moved steadily higher to a new uptrend high of 1399.54. After a minor pullback, the market rose again, moving slightly higher than the previous high, peaking at 1399.63. The market then continued trading in a very narrow range throughout the afternoon, until just before the close. At that point the market fell slightly below that range, moving down to 1393.82, before rising slightly into the close.

From Friday afternoon’s low of 1389, the market completed a 5 wave sequence to the new uptrend high of 1399.54. After that the market appears to have formed a semi-inverted corrective wave, bringing the market down to 1393.92 near the close.
If this count holds, a 5 wave sequence from 1354.65 will complete at 1400-1401. At that point the market would be due for a correction. Since I see this market moving higher, and the 5 wave sequence described above would be wave 1 from 1355, the possibility of a complex correction is fairly high. This would see the market top at 1400-1401, a small pullback, most likely slightly below today’s low, and then a move above 1400-1401. This would signal the next leg of this move higher is underway.
 The corrective wave from today’s high could carry to 1389, a move below that would mean the market completed a 5 wave sequence from 1355 today, and the correction could continue further.  A move above 1401 would also mean a 5 wave sequence completed today, but that the market is headed higher.
Support remains at 1387-1397, 1384, and 1367. Resistance is at 1406, and then 1426.

Sunday, August 5, 2012

Weekend Outlook 08/05/12

The market opened the week by moving to a new uptrend high of 1391.74. This completed a 5 wave sequence from the 1329.24 wave 4 low, meaning the market was due for a pullback. From the 1392 high, the market traded in a narrow range for the rest of Monday, and that range bound trading continued through Tuesday, and for most of the day on Wednesday. On Wednesday afternoon the SPX broke down below that narrow range, dropping to 1373 before moving back into the 1387-1379 range. The market then broke decisively to the downside on Thursday, dropping to 1361 near the open, and then after recovering to 1374, fell to 1354.65. This completed a 5 wave sequence from the 1392 high, and Thursday afternoon found the market climbing steadily back to 1366 near the close. That rally sparked a gap up opening on Friday, with the market hitting 1384, and then climbing to a new uptrend high at 1394.16.

Coming into this week, my count from the 1266.74 low had wave 1 completing at 1335.52, followed by a semi-inverted corrective wave 2 that took the market up to 1363.46, before terminating at 1309.27.  Wave 3 has been an extended wave, with wave 1 of 3 lifting the market to 1320.29. Just as with the larger degree wave, wave 2 of this sequence was a semi-inverted wave, with a high of 1374.81, and then ending at 1325.41. Wave 3 took the market up to 1380.39, before a wave 4 low of 1329.24. With four waves completed, the projection for wave 5 was between 1387, and 1404, which fit nicely with my 1393 projection generated by the sub-waves of the 1267-1335 wave. The sub-waves of wave 3 of this sequence also projected to 1387-1395. Monday’s move to 1391.74 satisfies all the criteria for the completion of wave 5 of 3.
If the move to 1392 completed wave 3 from 1267, wave 4 most likely terminated at 1354.65, and this would put us in wave 5. My targets for this wave have been either 1426, or 1497. The projection using the four waves completed so far would yield a range of 1335-1375 for the wave 5 high.
I view this current 1387-1397 support/resistance level as very significant. Until the market can clear this level, there are several possibilities. The current pullback from 1394 could end at this point, or extend down near 1378. A move slightly above 1394 would complete another 5 wave sequence from 1329, which would then be the termination point of wave 3 from 1267. Wave 4 could then terminate at a point that would more precisely target either 1426, or 1497. There is also an outside possibility that the market will complete a 5 wave sequence from 1267 at these levels, meaning the market could undergo a significant pullback, or even re-test the 1267 low. I see this as a low possibility because it would mean the move from 1267 to 1363.46 was a 5 wave sequence, which is not my current count.
Short term, the market is within the 1387-1397 support/resistance cluster. Support then would be at 1367, and then 1356-1358. Resistance is at 1406, and then 1426.