Thursday, May 31, 2012

Thursday's Market 05/31/2012

The market started off the day to the down side once again, selling off rather sharply, until it reached near 1302. After a small move up, the SPX continued the move down until reaching 1298.90. At that point a 5 wave sequence from 1335 was completed, and the market quickly rallied off that low. After an initial move to 1306, the SPX made it up to 1312 before it encountered any real resistance. Here the market spent some time consolidating, forming a semi-inverted corrective wave 4, before one final rally to 1319.74.

Once again, the rally from the morning sell-off was encouraging for the bulls, as the SPX moved into positive ground near the end of the day. However, once there, as has been the case lately, the market could not hold its gains into the close. The market sold off rather sharply, carrying the market into negative territory at the close. These sell-offs into the close have generally been a pre-cursor for a down move the following day.

It is still difficult to say which way this market will eventually breakout. The market is still in a trading range, waiting for some impetus to move it one way or another. Should we break above today’s 1320 high, and assuming the move from 1299 to 1320 was wave 1 of a larger move higher, we have two initial targets from wave 3. The first would be at 1324. Should wave 3 end there, it would suggest more choppiness ahead, with only slightly higher highs. The second target for wave 3 would be 1344. A move to this level would indicate the start of the rally everyone has been waiting for. On a larger scale, if 1292 to 1335 was wave 1, wave 3 would project to either 1335, or 1338. This would suggest that the first scenario we outlined is more likely.
To the downside, using 1335 to 1299 as a wave 1, wave 3 projects to 1298, or 1293. This suggests that we would be able to complete a 5 wave sequence without falling below the 1292 low, making a continuation of this trading range possible. The key level to the downside is the 1291.98 low. If the market takes that out, we could be headed to 1250 initially, and possibly the low 1200’s.
It may be that we will stay in this trading range, but the longer we stay in it the less likely it seems that we will break out to the upside. Only a break either above 1340-1344, or below 1292, will signal a breakout from this range.
Short term, look for 1324, 1335, and 1338 to offer resistance, while there seems to be a lot of support clustered between 1298 and 1305, and at 1293.


Quick Update 05/31/2012

Well! That certainly was interesting. We were looking for wave 3 down from 1334 today, to bottom near 1297. Instead it looks like we managed to get waves 3, 4, and 5, which bottomed at 1298.90, right near our 1300 support area, From there, the market rallied, completing 5 waves to 1320, again, very near our 1318.60 resistance level. After that, the market sold off pretty dramatically at the close, falling to 1311.

We will have more to say later this evening about where this market may be headed. For now we’ll leave it with our updated charts.


Support/Resistance 05/31/2012


Wednesday, May 30, 2012

Wednesday's Market 05/30/2012

The market opened sharply lower today, dropping below one of our support levels at 1318. Once below that level, the market consolidated for a short time, before resuming the decline, hitting 1311.18. The market tried to stage a rally from there, but could only make it back to our resistance line, topping out at 1318.18. After that, the SPX staged one more decline, reaching its low for the day at 1310.76, before moving slightly higher into the close.


The move yesterday from 1323 to 1333 would now appear to have been waves 1, 2, and 3, of an inverted corrective wave from 1323.40. Wave 4 come this morning in the sharp move lower at the open, with the small rise to 1318 completing wave 5, and wave 2 from 1335. The drop to 1311 formed wave 3, the rally to 1318 wave 4, and the day’s final decline to 1311 completed wave 5.
We now have a 5 wave sequence completed from 1292 to 1335, and a 5 wave sequence from 1335 to today’s low of 1311, leaving us again without a clear cut answer as to which way the market will head next.  With the completion of a 5 wave sequence today, we would expect a move higher, with an initial target of 1320. Before we can even think about the resumption of a rally, we would need to see a price above yesterday’s 1335 high.

We believe this market still needs to work lower before a rally attempt can occur. A move below 1311, in our opinion, would signal the start of that move lower. We see support at the 1301-1302 level, with resistance at 1327, and 1333.

Support/Resistance 05/30/2012

Tuesday, May 29, 2012

Support/Resistance Generated by 1292-1335 Wave Structure

If 1291.98 to 1334.93 is indeed a complete 5 wave sequence, here are the support/resistance lines generated by that wave.

Please see our earlier update for our complete outlook.

Tuesday's Market 05/29/2012

We missed very badly on our call from Friday, completing misinterpreting the wave from 1324 to 1314. The wave was complicated, but the 5 wave sequence was there, we just missed it. For that we apologize.

We were right in saying that a move above the 1324-1328 level would signal a new 5 wave sequence to the upside, as the SPX hit 1334.93 after clearing that level. Once hitting that level, the market pulled back, quite sharply and deeply in our opinion, before moving back up to 1333. While we were expecting that if we cleared 1324-1328, we would make a quick move to much higher levels, the sell-off from 1333 seemed a bit more than one would expect, with the subsequent rally back up rather subdued and choppy in comparison. Earlier it looked like an inverted corrective wave was forming, which would fit with the expectation of much higher levels being reached. It now appears something completely different took place, which may not foretell higher prices, at least not at the moment.

Last week we said we saw a 5 wave sequences from 1291 to 1328, 1328 to 1300, 1300 to 1324, 1324 to 1310, and 1310 to 1324. We further stated that these 5 waves came within .01 of a point of meeting our threshold for a complete 5 wave sequence from 1291. With the move from 1324 back to 1314 unfolding in what we now say is a 5 wave sequence, this would be wave 2 of a sequence from 1291. The spike today, as we see it, unfolded in three waves, 1314 to 1330, 1330 to 1327, and 1327 to 1335. This completed another 5 wave sequence from 1291.

The pullback today unfolded in 5 waves, as did the rally back to 1333. This could turn into another series of slightly higher waves, similar to what happened today. The danger, as we see it, is that we experienced a false breakout today, and the market will soon revert to moving to the downside.
On the bullish side, we have completed a 5 wave sequence down from 1335, which did hit a corrective support level at 1323-1324. So we could still be headed higher.
 A break above 1335 would signal another move to upside, with the next resistance level around 1340. If we clear that, the rally everyone has been expecting will be underway. If we start off to the downside, 1327 looks like the support zone for a correction from 1333. If that doesn’t hold, a move below 1323 would most likely signal the market is headed back down, possibly to test the recent lows.

Friday, May 25, 2012

Friday's Market 05/25/2012

Thursday’s late afternoon once again turned out to be another one of the market’s head fakes. After opening slightly higher and completing wave 5 from 1311. This turned into wave 1 of a larger sequence, and after a small pullback the SPX completed waves 3, 4, and 5 rather quickly, taking the market to 1324.20. The rest of the day was spent working lower, with a series of moves up and down; looking again like a double inverted corrective wave is forming. A clear 5 wave sequence was formed from 1323-1314, right near the 1315 support we pointed to yesterday. From there the market staged a small rally into the close.

We feel this morning’s move to 1324.20 may have great significance. Although very odd looking, it comes within .01 points of completing a 5 wave sequence from 1292. Given the bearish formation we see forming from 1324, it has become a distinct possibility. At the moment this only means that we are in a corrective wave, and doesn’t necessarily mean we will break below 1292. As we have already identified 1292 as a wave 5, the move to 1324 could have been wave 1 of a move higher, with the market now in wave 2.

We still feel this market could eventually break out in either direction, but we see at least one more move to the downside on Tuesday. A move above the 1324-1328 level would signal a breakout to the upside.

Thursday, May 24, 2012

Thursday's Market

The market opened higher today, moving above 1322, and completing wave 3 from yesterday, before pulling back. This took the market below 1316, where it reversed course, and moved higher to 1324.14. This completed the 5 wave sequence which began yesterday at 1300. Once again this kept the market below 1325, which we think is a critical level.

Much of the rest of the day was spent moving lower, which at its lowest point, 1310.50, was right at the 1310-1307 resistance level we mentioned yesterday. This wave turned out to be quite complex, whose main feature was an inverted corrective wave from 1319.95. The 5 wave termination point from 1324 turned out to be not the lowest point of the wave, but 1311.64.

From there things became more interesting. The market moved sharply higher, rising over 8 points in fifteen minutes. After a small pullback, this latest rally continued into the close, lifting the market over 1320.

This completed a 5 wave sequence from 1312. From the 1291 low, we have completed five sequences of 5 waves. 1291 to 1328, 1328 to 1296, 1296 to 1324, 1324 to 1311, and 1311 to 1320. With each successive wave terminating within the other, this is setting up to be a powerful move in whichever direction it breaks out. This is taking on the appearance of another double inverted corrective wave, such as the one we have been discussing for the past several days. This should be of a larger degree than the one we saw on Tuesday into Wednesday, and will move the market to greater extent. With the wave structure such as it is, the market could move in either direction, and exhibit the double inverted corrective wave characteristics.

With today’s late move higher, it would appear that this formation will eventually resolve itself with a move to the upside. We are not totally on board with the bullish argument. With the market having been severely oversold recently, it has thus far failed to create the “buying mania” many have envisioned. Some of that oversold pressure has now been alleviated, and the question becomes whether those technical measures can still propel the market higher.
Whichever way the market wants to move, it should happen soon, as the waves are becoming increasingly smaller. We believe the market closed today by completing a 5 wave sequence higher, so we would expect a move lower at the open. We see support near 1315. If that level breaks, a move below 1311.64 would mean we have begun another move lower. From there, 1300, 1296, and 1292 are the levels to watch.
 If the market moves higher, a break above 1325 would signal a breakout to the upside.

Wednesday, May 23, 2012

Wednesday's Market 05/23/2012

Yesterday we outlined a double inverted corrective scenario from 1328.49, which we felt had the potential to move the market below its previous low of 1292, and possibly down to 1280. The market did open lower today, dropping below 1306 before rallying back to near 1312. This completed waves 2, and 3 of the first inverted corrective wave, which terminated with a drop to 1298, and a final rise to 1303. This also marked the end of wave 2 from 1324.94.

With this wave completed, the market moved lower once again, this time forming waves 3, 4, and 5 of that sequence in quick succession, finishing wave 2 from 1319.82 at 1296.53.

Up to this point things were going pretty much as expected. Although these types of waves can unfold in many different waves, we would normally have expected a small move higher for wave 3, followed by a larger wave 4 down, and another small move up for wave 5. Following that would be a 3-4-5 move to the downside to complete the entire sequence from 1328.49. Waves 2, and 4, are less predictive than waves 1, 3, and 5, and act like impulse waves in an inverted correction.
We did get a small move higher at this point for wave 3, but wave 4 was quite short. Wave 5 of this sequence carried the market to 1306.11. We did then see a 3-4-5 wave move down to 1300.33 to complete the 5 wave sequence from 1328. After wave 5 the market staged a strong rally, which unfolded in a neat 5 wave sequence which lifted the market to 1320.73. The SPX then faded slightly into the close, without completing a 5 wave sequence.
Although today’s move did not carry as far as we thought it might, it did play out as expected. The resultant wave structure is rather odd looking, but satisfies all the criteria of our model. There are several, make that many, counts that come close to satisfying our model, but fall short in one aspect or another. For that reason we will stick with this count unless the market says different.

The action today was interesting in several respects. First, it failed to take out its previous low. Secondly, despite an extremely strong rally into the close, it failed to move to a new high, or even make it past 1325, a point we think may be significant. One of the counts we were looking at is wave 1 from1328-1320, wave 2 from 1320-1325, and wave 3 from 1325 to 1297. The rally failing to move above 1325 keeps this count as a viable alternative, with wave 4 terminating at 1320.73. Of course the projection for that scenario is 1280, a number that seems to keep popping up.
For the moment, we see the market opening lower, having not yet completed a 5 wave sequence from 1321. From there we will be waiting t see if the market can break first 1325, and then 1328. A move above the latter would signal another sequence to the upside. We see support between 1310 and 1307, and should we break that we will watch 1300. If we also break through that we will probably be entering another sequence to the downside, with a move to new lows confirming the new downtrend. We maintain the view that 1292 completed a 5 wave sequence from 1422. From there we formed a 5 wave sequence to 1328, and what appears to be a 5 wave sequence down to 1297. From here it is a bit of a waiting game to see which way the market will break.

I do not follow the DJIA as closely as the SPX, but with the previous thought in mind, that index appears to have completed an important sequence that could offer clues as to which way the market will go. From the April high of 13297.03, that index seems to have just completed a semi-inverted corrective wave. From there the market moved lower to 12711, and then made a new high, rising to 13389. A 5 wave sequence took the index to 12792, holding above the previous low, and then rose to 12932. The index then completed a 5 wave sequence to 12312. This also is within the range for completing the semi-inverted corrective wave from 13297. These waves cannot be followed by another sequence in the same direction, and therefore signal trend changes. If the DJIA can move above 12576, we would most likely have seen the bottom. A move above 12932 would confirm this. There is still room within the range to move slightly lower, but a move higher at this point would give us reason to believe we are on our way back up.

Tuesday, May 22, 2012

Tuesday's Market

Yesterday we said we thought we were at, or near a 5 wave sequence high from 1292, and we would expect a lower opening. Instead, the rally from Monday carried over into today’s open, and the market moved higher, to 1319, still within our target range. At that point we did see our pullback, and when the market moved above 1319, another 5 wave sequence to the upside was confirmed. The rally appeared as strong today as it did yesterday, as the market quickly moved up to 1328, which completed the 5 wave sequence.

Things went south from there, with the SPX dropping to 1320, and then bounced around between 1320, and 1325. However, 1320 couldn’t hold, and the market fell to 1310, before staging an almost seven point rally into the close.

In yesterday’s recap we said we expected 1323 to prove a resistance level. The range for that level was 1320-1328, exactly where the market stopped, both at the top, and on its way down.
We see 1328 as the termination point of a 5 wave sequence from 1392. The move down to 1319.82 was a 5 wave sequence, as were the moves from 1319.82 to 1324.94, 1324.94 to 1319.92, and1319.92 to 1324.89. From there the market formed a 5 wave sequence at 1317, which then became wave 1 of a sequence that terminated at 1310.04. As of now we do not see the completion of a 5 wave sequence from 1328, to 1310. In fact, we see something quite different than a mere corrective wave from 1328. We see 1328-1320 as wave 1 down, followed by wave 1 of an inverted corrective wave 2, which terminated at 1324.94. The move to 1319.92 was another wave 1 of lesser degree, again followed by wave 1 of an inverted corrective wave 2, which terminated at 1324.89. These wave structures do not end well, usually indicating a sharp move in the direction of the underlying trend, which is down.

The wave from 1370 to 1077 had a very similar structure, and we’ve included a chart for comparison. This is normally how these waves play out, with a sharp move, followed by increased volatility as the waves resolve themselves. I am not comparing the magnitude of the move, only the structure of the wave.
At the moment, if this plays out as we’ve lain out; we would expect the lower limit of this move to be 1280. Over the weekend I posted a possibility of the market rallying to 1322 from current levels, then move down in wave 3 from 1422 into the 1276-1238 range, followed to a move to 1238-1164 after wave 4. Right now that appears to be the track we are on.

Of course, we have been wrong before, and we will be wrong again, but we see this as the most probable scenario given the current wave structure. 1328 now becomes a critical level. If we can surpass that, this scenario would be eliminated, with higher prices expected as the market completes another 5 wave sequence to the upside.
There is some hope for this scenario. After wave 1 from 1328 terminated, the market trade between 1320, and 1325. There were three moves to the upside, and this 5 wave sequence which almost, but did not quite, meet our criteria. Had it met our criteria, it would have qualified as an inverted corrective wave itself. From that termination point, there is a count from 1328 that almost, but again, just doesn’t quite, meet our criteria. That’s why, for the moment, we prefer the first scenario. A move above 1328 would make this second scenario valid.


Monday, May 21, 2012

Monday's Market 05/21/2012

Last week we said we were within the target range for the termination of a 5 wave sequence from 1422. On Friday we said it looked like we had completed another 5 wave sequence at 1291.98, and we could see a rally from that point. Over the weekend we said we could see a rally, possibly to the 1323 area. This morning, on Stocktwits, we said a move above 1300 could trigger a rally.

1300 was the termination point of the last wave 4. A move above that level would signal a termination of the current wave, and the 5 wave sequence from 1422. The market opened higher today, initially reaching 1301.02, before pulling back slightly. From there the market moved sharply higher, completing the first 5 wave sequence from 1292 at 1308. After another small pullback the market turned higher again, completing another sequence from 1292 at 1312, and what appears to be another at the close, at 1316.39.

It now appears that the 5 wave sequence from 1422 is over, and the question now becomes what next? Short term we believe a 5 wave sequence has completed from 1292. We would expect a pullback at this point, with a move below 1314 confirming the completion of the wave. If the market moves higher from there, another 5 wave sequence to the upside would be unfolding. We still look at the 1323 level as resistance, and a move above that could mean this is more than a short correction, and we could move significantly higher. A move below1292 at this point would make this wave 2 of another sequence down from 1422.

With the completion of the 5 wave sequence from 1422 at hand, there are several possibilities to consider. The first possibility would be that the correction from 1422 is over, and we are entering a new bullish trend. Since we still view 1422 as a 5 wave high from 667, this wave still seems rather small comparatively, making this unlikely, but possible. The second possibility is that the drop to 1292 was merely wave 1 of a 5 wave corrective sequence, and this is wave 2. If the market moves below1292, this would be the most likely scenario. The next possibility is that the move was wave 1 of a more complex corrective sequence, either an inverted, or semi-inverted corrective wave.  If this is a semi inverted corrective wave, wave 2 should take us above 1422, and wave 3 back below 1422, but terminating above 1292. Wave 4 would end below 1422, and wave 5 would take us below 1292. An inverted corrective wave would see waves 2 and 4 as impulsive looking waves higher, with waves 3, and 5 being short corrective sequences. Normally this would take the market to much higher levels.

At the moment we cannot determine which of these outcomes will actually transpire; we can only keep these in mind as the wave unfolds.

Sunday, May 20, 2012

Weekend Update 05/20/2012

Our model is based on the relationship exhibited between waves. We mainly use the relationship between the 5 waves in a trending sequence. There also seem to be other relationships among waves; one is the relationship between waves in a counter-trend, and the waves in the previous trend. With the termination point of wave 5 from 1422 pretty open ended at the moment, we have analyzed this secondary relationship in order to get a better picture of what’ s happening in the market.

Since we believe this is a corrective sequence of the 5 wave sequence from 667-1422, we started with that wave. This secondary relationship does not project all waves in a series, but seems to project either waves 1 OR 3, wave 2, and wave 5. Using the aforementioned trend sequence, we get a projection of 1238-1276, with 1258 being the optimum, for the termination point of either 1 or3. Wave 2 should carry the market back to between 1277 and 1322, with 1299 being the optimum. Wave 5 should then take the market back down, somewhere between 1238 and 1164.

Since this would also be a corrective sequence from the 1075-1422 trend wave, we also analyzed the waves using that sequence. The first projection was near 1332, this being for wave 1 or 3. We have wave 3 from 1422 terminating at 1348. Wave 2 projected at 1412, with our wave 2 being 1415. Wave 5 should terminate between 1297, and 1266, pretty much where we are now.

With our projection of 1276-1238 for wave 1 or 3, we could continue lower from this point, until we enter that target range. This would terminate wave 1, we would see a rally into the 1277-1322 target range, and then a 3-4-5 sequence into the 1238-1164 target range.

We could also rally from this point, or somewhere near this point, keeping the market below the 1322 maximum wave 2 target, and then have wave 3 carry into the 1276-1238 target zone. Wave 4 would fall short of the wave 2 peak, and wave 5 would bring the market into the 1238-1164 range.

In our mind this method is slightly less accurate than our primary relationship, but it does add value to our analysis. We continue to be in wave 5 of the downtrend from 1422, and so could see a rally at any point. As we have shown above, we still believe there is risk to the downside. With the market being as oversold as it currently is, it would not be surprising to see a rally from here, or after another move to the downside, but we do not believe the correction from 1422 is quite over.

Saturday, May 19, 2012

Friday's Market 05/18/2012

Today was not a whole lot different than what we have seen recently. After opening slightly to the downside, the market made a quick run, stopping shy of 1311. After falling back near break-even, the market staged another rally, making it above 1312. This would prove to be the high of the day, however, as the market quickly reversed course, and dropped below 1300. After rallying back to 1307, the SPX moved steadily lower through the afternoon, falling to 1295. After moving back up to 1300, another down move took the market to 1292 shortly before the close, before rising slightly into the close.

As we discussed yesterday, the market has been unfolding in a series of 5 wave sequences from 1365.88, where wave 5 becomes wave 1 of the next sequence, then completes waves 2-5, with that becoming wave 1 of the next sequence, and so on. The first completed sequence occurred at 1326, and a second one completed Friday morning at 1305. The action today completed yet another sequence at 1292.

The market is now within the target range for completing the 5 wave sequence from 1422, so the bottom could be the termination point of any one of these sequences. However, we still see significant downside potential, as this target range is rather large.  
At this point all we can say is we are in a continuation of the downtrend from 1422. A rally could ensue at the completion of this sequence, or any future sequence, but a drop below the wave 5 level will mean that the downtrend is continuing.
We’ll have more to say at some point this weekend.

Friday, May 18, 2012

Thursday's Market

It was another rather dismal day for the market. After opening higher, the market quickly gave back its gains, falling to 1311 before any attempt at a rally. After moving up to 1319, the SPX moved steadily to the downside for the rest of the day closing at the low of 1305.37.

Earlier today, we thought the wave structure was playing out in such a way that we should see a low if the market held above 1303. From there we thought the market was set for a rebound, and possibly the end of the correction.
We have been operating with the idea that we have been in wave 3 of a 5 wave sequence from 1415. Recently we posted that there was a possible 5 wave count from 1415 to 1348. We’ve spent most of today reviewing our charts, with the market not behaving as we thought it would. By using that 5 wave count from 1415 to 1348, it would out us now in wave 5 from 1422. The target ranges are similar to what we have been projecting, and this was accomplished without changing any of our 5 wave counts, but only how they are put together.

From 1422 we have 1357.38-1415.32-1347.75-1365.88, with a target for wave 5 under 1314, which we have met. Wave 5 of the sequence then began at 1365.88. A 5 wave sequence from there was completed at 1325.95. That then became wave 1 of a larger degree sequence which should terminate between 1307, and 1302, right where the market is now. Since we have wave 5 of wave 5 from 1422 terminating at current levels, one would expect the completion of the 5 wave sequence to be imminent.
There are some disturbing features to this wave however, which is why we are not calling this the end. The downside limit of wave 5 from 1422, under the current count, leaves a lot of room to the downside. Additionally, the way the 5 wave sequences are playing out from the beginning of wave 5, 1365.88, could result in a succession of 5 wave sequences to the downside. In this type of set-up it is difficult to call a bottom. With all waves from 1422 within their target termination zones, we could also be at a bottom. 1302 is the lower limit of our target zone from 1366. If we can hold that at the open, we could see a pretty good rally. A break of that would mean another sequence to the downside would need to be completed.

Thursday, May 17, 2012

Thursday Update 05/17/2012

It now looks like from the wave 3 low of 1326 from1347, the market is forming an inverted corrective wave 4. At some point we should see a rally of something greater than 7 points on the SPX, and then one final move down. Our lower limit for the wave from 1374 is 1295, so we expect the bottom to be above that.

When this wave terminates, all waves from 1415 will have been resolved, and we could expect a rally.

Wednesday's Market 05/16/2012

Yesterday we discussed a possible count that would make 1328 the completion of a 5 wave sequence from 1347, and wave 1 of a larger sequence from that point. We suggested that if the bounce off that low to 1334 were wave 2, we could expect the ensuing waves 3, 4, and 5 to play out something like 1317.40-1325.20-1311, with 1311 being our optimal target from the 1415 high.

1334 turned out not to be the end of wave 2, with the market rallying at the open to 1341.78, and in the process moving above 1340.54, confirming the possible count from yesterday. Despite what looked again like a pretty impressive rally, the market quickly reversed course, and headed to the downside. A drop to 1331was followed by a small bounce, and the another move down to 1327. Once again the market bounced, then fell once again until it hit 1326. This completed a 5 wave sequence from the morning’s 1342 high, and wave 5 from 1347. Interestingly, had this drop started at yesterday’s 1334, it would have taken the market to 1317.80, very close to the price we discussed yesterday.

The market attempted to rally from there, but made it only to 1331 before moving lower still. The SPX continued down into the close, reaching 1324.79. This number is significant in that the SPX is now below 1325, and within the range we have been targeting as the termination point from the 1415 high.

While the market has reached the target level from that high, it has not yet reached the target range from 1347, nor 1342, which for both are at the 1319-1320 range. Ideally we would like to see the market hit those levels, reaching the target from 1415 would be sufficient to call this the bottom. We have noticed that when the market closes very close to a target level, but not quite within it, it turns out to be a termination point. That may well be the case here.

The move from 1342 appears as some sort of triangle, with a move to the lower trend line of that triangle bringing the market within both of the above target ranges. These triangle formations can turn into rather extended formations, completing one 5 wave sequence, which turns into wave 1 of another sequence, which forms in ever smaller ranges. Until we break through those trend lines, we can assume that scenario is in play. By our current count, a move above 1331 would mean that all the waves from 1415 have been completed.
We do, however, continue to believe that this is only wave 3 from the 1422 high. We do expect a substantial rally from this point, but it would only be wave 4, and should not surpass the 1422 high. This rally should be followed by another move to new lows. Again, with our current wave counts, the less pronounce the rally, the lower wave 5 will carry. The best case scenario is a move back near 1400, which would be followed by a low only slightly below the current one. Should we see a short-lived rally, wave 5 will project much lower.

Wednesday, May 16, 2012

Wednesday's Market Quick Update

I will be posting a more thorough update soon, but wanted to give a quick update now.

Given today’s action, the alternate count we discussed yesterday appears to be what played out. 1328 was indeed the completion of a 5 wave sequence from 1347, and in turn wave 1 of a larger degree sequence. The wave 2 rally from 1328 ended up being longer than we accounted for yesterday, but from the termination point of wave 2, the rest played out pretty much as we suggested.

The market turned lower from there, and at 1326 completed wave 3, taking out the 1328 low. After a bounce back to 1331, the SPX fell below the 1326 low, down to 1324.79. This puts the Index within our wave 5 target range from 1415, but still slightly above our target of 1319 from 1374. The current 5 wave sequence from 1347 would also have a slightly lower target.

A triangular shape seems to be forming from 1342 wave 2 high, with a drop near the lower trend line completing both the 1374, and 1347 5 wave sequences.

While ideally we would still like to see 1319 to resolve all the wave structures, what we would like doesn’t always happen. With the minimum target level for the move from 1415 having been met, it is time to start considering a bottom. From this point, a move above 1331 would most likely signal the bottom, and a move above 1347 definitely.

Tuesday, May 15, 2012

Tuesday's Market 05/15/2012

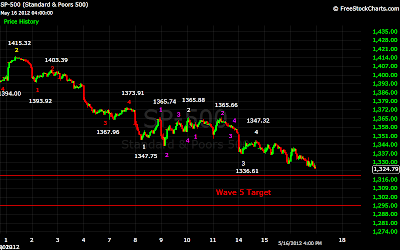
After a choppy open, the SPX put in a 5 wave sequence bottom from 1347.32 at 1336.80. The market then rallied back to 1344, before falling to new session lows just above 1335. The market then rallied again, this time moving up near 1345. This completed the semi-inverted corrective wave from 1337, and what we believe was wave 2 from 1347.

The SPX fell back to 1336, before attempting to rally again. This rally cloud only get the market back just above 1340. The selling accelerated during the afternoon, with the SPX falling to a new session low at 1328.41. The market did try to rally once more, but could only make it above 1333, before dropping back down into the close.


We continue to believe we are in wave 5 from 1373.91, and wave 5 from 1415.32. Our projected low from wave 5 from 1415 is 1325-1260, and 1319-1295 from 1374. Therefore the move from 1415 should be between 1319 and 1295. From that point we should see a rather substantial rally. We still do not think this will be the low from 1422, however, as this still appears to be wave 3 from that point.
If our counts are correct, we have only to complete a 5 wave sequence from 1347. Up until now, 1337 seems the most likely point for wave 1, and 1345 for wave 2. From there things are a bit less clear. We see a distinct 5 wave sequence from 1345 to 1336, and another from 1341 to 1328. If these were waves 1-4 from 1345, wave 5 would project to 1319, and we would need to rally from there back to the 1340 level just to project wave 5 of the sequence to terminate within the ranges from 1374 and 1415. While this is possible, it seems unlikely at the moment. Almost all of the solutions possible would require several more waves to play out, while we have always envisioned this stage of the sequence developing fairly quickly.
A stranger, but at this point much more likely scenario, has appeared with the wave action from today. This would put wave 1 from 1347 at 1339.76, followed by an extremely rare, from our experience, expanding corrective wave 2 which ended at 1344.94. This would make the two 5 wave sequences from today’s 1345 high, and the intervening corrective wave, waves 3, 4, and 5 from 1345. We have labeled these points as A1-A5 on the following chart. If this 5 wave sequence in turn becomes wave 1 of a larger degree sequence from 1345, the entire move from 1415 would end with two more sharp moves down, with a small corrective wave in between. This would fit much more closely with our overall scenario. Using our optimal target from 1311 from the 1373 high, this would play out something like 1317.4-1325.2-1311 from 1333.63. These are approximations of course, but in any event wave 5 should be slightly shorter than wave 3.

If we move above 1333, we will stay with our current count, and we could rally back near 1345. 1366 would be the next level to watch, with a move above that likely signaling the end of the current move.


Wave 5 Target


Semi-Inverted Corrective Wave Completed

It looks like the 1337 low hit this morning was the termination point of wave 5 from 1347 as we discussed yesterday. We did then see the expected bounce, which looks like a semi-inverted corrective wave.  We believe this wave has now ended, and we should be on our way back down from here.