Monday, April 30, 2012

The Beginning of Wave 3 Down?

The market spent most of last week to the upside after putting in a low at 1359 last Monday. Hitting the 1406 level on Friday put us within range of completing of a 5 wave sequence from that low, with a possibility of moving slightly higher before heading once again to the downside.

On Monday the direction was decidedly down, moving quickly to 1395. At that point the market attempted to rally, moving back near the 1400 level, before turning down once more, this time dropping to 1394. From there the market found some support, moving higher, back to 1398, as it neared the close. In the last few minutes of trading the market dipped to 1396.59, then rose to 1397.80 into the close.

It would seem today’s action confirms 1406 as the termination of the 5 wave sequence from the 1359 low. Last Friday’s drop to 1403 we consider to be wave 1 from that high, with the rise to 1405 wave 1 of an inverted corrective wave. Monday’s opening drop was part of wave 2, with the inverted corrective wave terminating at 1398.13. We expect the market to continue to the downside on Tuesday, with waves 3, 4, and 5 yet to be completed. This should be the continuation of the correction from 1422, and we will consider it as such. At this point a move back above 1406 would indicate another move higher. Levels to watch on the downside are 1385, 1359, and 1357. Breaks of these levels would be short term bearish.
Once again, we believe 1422 marks the high from 667, with a correction to 1388 being wave 1 of wave 2. From 1388 the SPX created an inverted corrective wave that terminated at 1359. The moves to 1391, 1385, and finally 1406 completed waves 3, 4, and 5, and wave 2 from 1422. We should now be moving back down for wave 3.


Sunday, April 29, 2012

Friday's Market

On Friday, the market opened higher, and quickly rose to 1405. That rise was followed by a sell-off, pushing the market down to 1397. We believe this was the termination of a semi-inverted corrective wave from Thursday’s 1402 high. After falling to 1397, the market recovered, steadily rising to 1403, falling back a point, and then resuming the move higher to 1407. The market faded once again into the close, falling to 1402.43.

Friday’s action continued the rise from the 1385 low, completing wave 4, and waves 1, 2, 3, and 4 of 5 from that point. We think the market can make one more move slightly higher, to 1308-1311, before completing wave 5 of 5. That should complete the 5 wave sequence from 1357, and perhaps resuming the move from 1422.

We still believe we can move lower, continuing to target the low 1300 level from the 1422 high. Should we move above 1422, we think the market could move higher, with our target the 1460 level.

Thursday, April 26, 2012

The End of the Correction?

After the run-up on Wednesday, we were looking for a pullback today, calling for possibly a move below 1385. This was based on our analysis of the move up being part of an inverted corrective wave which terminated on Wednesday at 1385. We have been keeping an eye on a slightly different count that would make Wednesday’s 1391 opening high a wave 5 termination point. We will discuss this count further in a moment, but for now we’ll take a look at Thursday’s action.

The market opened slightly lower, but very quickly reversed course, rising to 1393, and moving above the high from Wednesday. We now believe this completed a 5 wave sequence from Wednesday’s 1385 low. After correcting slightly to 1390, the market turned higher once again, hitting 1393.52, pulled back to 1392, and then turned markedly higher. Closing in on 1398, the SPX completed another sequence from 1385, but barely paused as it continued higher, eventually topping at 1402.09. This completed yet another sequence from 1385. The market pulled back towards the close, falling just below 1400, and closing at 1399.98.


Yesterday we said we saw a 5 wave sequence from 1358.79 being completed at 1391.37. However we were keeping an eye on a concurrent count that pointed to 1390.81 being the 5 wave termination point from. These two counts seemed to be converging on the same point, but today’s action makes it clear that 1390.81 is the correct termination point. The waves for this count would be 1358.79-1365.79, 1365.79-1361.91, 1361.91-1375.57, 1375.57-1367.86, and 1367.86-1390.81.
So now, if we look at the wave structure from the 1357.38 low, we count a five wave sequence back up to 1388.13. From there the SPX formed a semi-inverted corrective wave, bringing the Index back down to 1358.79. Up to this point, we continually stated that we did not count a 5 wave sequence from 1358 -1393, and we did not see the correction as being over. We remarked at the time that holding above the 1357 level may prove to be important, and first suggested a semi-inverted corrective wave having formed. We called for a move slightly above the 1388 high for wave 3 of this sequence. As we stated earlier we now consider 1390.81 the termination point of wave 3. The slight pullback to 1385 was wave 4, and today’s action to 1402.09 should complete wave 5. We now have a 5 wave sequence having been completed, and would now expect the down trend from 1422 to continue.

Should we move back down below 1385, and then break into higher ground, it would appear that the move from 1357 to 1402 was only wave 1 of a move much higher. We expect the market to continue lower from this point, but we will keep an eye on those levels for indications that the correction is over.

Wednesday's Market

Yesterday we said we had completed waves 1 and 2 from the 1359 low, and that we should see a move higher. With the earnings news from Apple, that was a no-brainer. The market opened much higher, hitting 1390.81 in the first half hour. From there the market consolidated, moving lower to 1385 just before 1:00pm. From there the market moved to 1390, pulled back, hit a new intra-day high at 1391.01, pulled back again, and then hit the high of the day at 1391.37. The market spent the last hour trading in a narrow range from that high, down to 1388.

By our count, the action from Tuesday’s 1375.57 high was an inverted corrective wave 2 which terminated Wednesday at 1384.78. From there the market completed waves, 3, 4, and 5 at 1391.01, 1386.30, and 1391.37 respectively. This completed the 5 wave sequence from 1359 slightly above 1388.13 as we discussed might be the case in yesterday’s update. This leaves intact our count from the 1357.38 low as wave 1 terminating at 1388, a semi-inverted corrective wave 2 ending at 1358.79, and now wave 3 terminating at 1391.37.

If this count is correct, we can expect a move lower from here, with the market most likely moving below 1385, and then moving back above, 1391.37. This would complete the 5 wave sequence from 1357, and pave the way for the move down from 1422 to finally continue. Should the market fail to move below 1385, the projected wave 5 high would be above 1422, perhaps signaling the correction is over. At the moment we would expect wave 4 to bottom back near the 1360 level, which would project a high slightly above today’s 1391.37. This would keep the action nicely within the current trading range, and satisfy our model.

The current move could possibly extend slightly higher, so we would need a move back above 1422 to invalidate this count.

Wednesday, April 25, 2012

Tuesday's Market

From Monday’s 1359 low, we identified a 5 wave sequence terminating at 1368, and stated a move above that level would signal another sequence to the upside. Within the first few minutes of trading we were through that level, initialing hitting 1370, and after a small pullback, the market moved to 1371.

That level marked the end of another 5 wave sequence from the 1359 low, but the market was not done yet. After correcting to 1369, the SPX gathered steam and surged to 1375. The ensuing corrective wave was choppy, but the market eventually continued higher, hitting 1375.57, and completing another 5 wave sequence from 1359.

From that high, the market turned lower, spending most of the afternoon giving back almost all of the day’s gains. By the time the 5 wave sequence from 1375 was over, the market had fallen back to 1368.

The market moved higher towards the close, completing a 5 wave sequence at 1373, before dropping to 1371 into the close.

From here we looking at first the 1372.65 level to signal a move higher, and if we move above 1375.57, we could be looking at another run back towards 1400. We mentioned yesterday that it was interesting that the market held above the 1357 low, and that could mean that the corrective wave from that level was not yet over. The wave structure of this correction has been puzzling, with the market forming three identifiable waves from that level, but we could not identify a 5 wave structure. It now appears that the drop to 1359 may have been wave 5 of a semi inverted corrective wave from 1388. Should this turn out to be the case, we could expect first a 5 wave sequence carrying above 1388 for wave 3, a corrective wave 4, and then one more sequence higher to complete wave 5 of the corrective sequence from 1357. Should we break through 1357, we would assume the corrective sequence was over, and the move down from 1422 would continue.

We still believe that 1422 will hold for awhile, and that we still have a ways to go to the downside, but that may have to wait for the moment.

Monday, April 23, 2012

Monday's Market

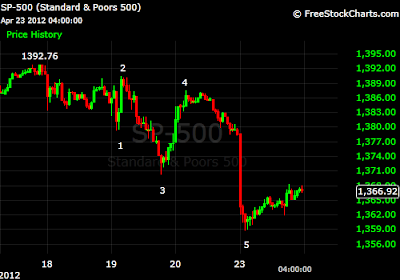
The market opened sharply lower today, in what appears to be the continuation of the correction from 1422. Within the first hour the SPX hit 1358.90, completing a 5 wave sequence from 1387. From that low the market spent the rest of the day trying to regain its losses, beginning with an initial rise to 1363.
By 1:00PM, the market had rallied to 1376. This completed a 5 wave sequence from the day’s low, meaning the market would head lower once again. It did, dropping to 1362, but holding above the low of the day. Another rally ensued, making it first to 1367, and then after a small move down, to 1368. This completed another 5 wave sequence from the day’s low of 1359. The market dipped heading into the close, dropping back to 1366, before rallying back close to the day’s high right before the close.

As we said, today’s drop to 1359 completed a 5 wave sequence from 1387, and also completed a sequence from 1393. It appears that this will be the continuation of the move down from 1422, of which this would be wave 3. A move below 1357.38 would confirm this, and probably mean some more sharp moves to the downside. A move back above 1368.26 would mean another 5 wave sequence still needs to unfold from the 1359 low from today.

Interestingly, the market held just slightly above its previous 1357.38 low, leaving open the possibility that the correction from that level is not yet over.

Sunday, April 22, 2012

Friday's Market

The market opened sharply higher on Friday, rising to 1384 before running into any resistance. It appears waves 1, 2, and 3 of a 5 wave sequence were completed on Thursday, with Friday’s opening surge the result of an inverted wave 4. This wave terminated at 1381, allowing wave 5 to carry the market to 1387.

From there the market dropped slightly to 1385, before trying to rally once again. This attempt fell short of the 1387 high, and the market turned lower, gaining downward momentum through the afternoon. A 5 wave sequence from 1387 was completed at 1380, and after rising a few points, quickly fell below 1380, starting another sequence down. It appears to us that another 5 wave sequence from 1387 was completed at 1378, which sets the stage for a rally on Monday.

1378 most likely marks the end of a corrective sequence from 1387, and completes wave 2 from the 1370 low. We still view this as wave 5 from the 1357 low. This should carry us to 1396, at which point we can resume the downward move from 1422.
We would expect the current wave to hit 1391, 1385, and then 1396 to complete this sequence. 1370 is the level to watch on the downside, with a move below that signaling the continuation from 1422 is underway.

Thursday, April 19, 2012

Thursday's Market

Well, if nothing else, today’s action was a bit easier to follow than yesterdays, and we believe it also clarified some of the wave action. It now appears that Wednesday’s wave action consisted mostly of an inverted corrective wave, and most of a wave 3. The 1390 high made in the last hour on Wednesday we would now consider the termination of an inverted corrective wave from Tuesday afternoon’s 1390 low. While the termination points we discussed yesterday remain the same, their relationship within the current wave structure has changed.

Yesterday we said we were closing at a wave 5 termination point from the 1390 high made earlier that afternoon. Today the market opened lower, than rose slightly before falling to 1382. This formed another 5 wave sequence from that 1390 high, and also took out the 1383 level we had pointed to as an important support level. We believe the 1382 was wave 3 of a sequence. From there the market staged a rally, rising to 1388, before heading towards new lows, which it made at 1379. From this 5 wave sequence low, the market staged one more pretty impressive rally, rising to 1390. From there it was downhill all the way, as the market rapidly fell to new intraday lows, finally bottoming out at 1370. This completed another 5 wave sequence from 1393, and wave 4 from the 1357 low. We still believe we need to make one more high in this sequence, which we now project to be at 1395. That should complete the 5 wave sequence from 1357, and set the stage for another move lower.

At the end of Thursday’s session, the market completed a 5 wave sequence up, in what we would consider to be the first move to 1395. The critical area to watch on the downside would be the 1365 low. Should we take out that low, it would appear the current corrective phase is over, and we will be headed back to the downside.


Wednesday, April 18, 2012

Wednesday's Market

It turned out to be quite an interesting day for the market, which created some very complex wave structures. Starting out to the downside, as expected since the market had not completed a wave sequence from Tuesday’s 1393 high, gapping down and hitting the day’s low at 1383 in the first several minutes. This did complete the 5 wave sequence from 1393.

From there the market traded in a tighter range, in what appears to be the formation of another 5 wave sequence from the 1393 high. Several of today’s waves looked a little odd, but seem to be correct based on the wave counts of the more minor waves, and the expected behavior from the 1357 low.

From Wednesday’s initial low of 1383, the market rallied, completing a 5 wave sequence at 1389.80. This was followed by another move down, bringing the market back down near the 1383 low. A second 5 wave sequence to the upside then unfolded, carrying the market back to 1388. After hitting that level the market turned lower for a third time, a five wave sequence which featured an inverted corrective wave 2, and once again the market found itself at the 1383 level. We believe this completed the second 5 wave sequence from the 1393 high.

From there the market showed some strength, rallying back to 1390, where it terminated a 5 wave sequence. However, from there the market gave up most of those gains going into the close, falling back to 1385.

At 1385 the SPX completed a 5 wave sequence, which we believe to be a wave 2 of a sequence from 1383. From here we expect the market to rise back up to 1400, where it would complete the 5 waves from the 1357 low. From there the market may turn lower once again.
As we said at the beginning, several of these waves appear to be not typical. We believe we are interpreting them correctly, but we would view a break of the 1383 level to signal another move to the downside. If we hold 1383, we should be on our way to 1400.

1400 One More Time?

It turned out to be quite an interesting day for the market. The small dip we anticipated at the open never materialized, and although we expected another move higher, the move turned out to be stronger than we envisioned.

The market opened higher, rising above the 1380 level we said would lead to a continuation of the correction from 1357. After moving above 1380, the market paused and dropped back to 1377. It is now apparent that wave4 of the correction from 1357 occurred at 1369.41, shortly before yesterday’s close. The slight rise from there, and then the dip into became wave 1 of the next move higher, and wave 1 of an inverted corrective wave that result in the sharp rise at Tuesday’s open. Although a bit unorthodox, normally wave 4 of an inverted corrective wave would carry beyond wave 2, this wave terminated at 1377.
When the market hit 1384, it completed 5 wave sequences from the 1369 low, and the 1365 low. A short move to 1382 followed, in what would turn out to be another inverted corrective wave from 1384. This wave carried above that level, indicating yet another move higher. This corrective wave took the market to a high of 1391, before completing at 1390. Having finished wave 2 of this sequence, the market then continued higher, completing the 5 wave sequence at 1393.

We believe this to be the completion of wave 3 from the 1357 low, which would indicate we have at least one more move higher to complete the sequence. It would appear that a drop to 1389 would complete a 5 wave sequence from 1393, which we believe would be the end of wave 4 from 1357. One more move to right around 1400 would complete the 5 wave sequence from 1357, and be the point from which we will once again move lower.

Our view that the market made a major top at 1422 and that we are in a corrective sequence from that level remains unchanged.

Monday, April 16, 2012

Monday's Market

We got the stronger opening we expected, with the market moving up to 1380 in the first few minutes of trading. We warned this rally might be short-lived, and that turned out to be the case. From 1380 the market turned sharply lower, breaking through Friday’s 1370 low, and continuing down until it completed a 5 wave sequence at 1365.38.

From that low, the market spent the middle of the day in a corrective mode, working its way back higher, but not surpassing the earlier 1380 high. The market completed the first phase of the correction at 1371. From there it completed a 5 wave sequence down to 1366.48. Another rally followed, the market completing a 5 wave sequence at 1371 once again, then continuing on until it completed another 5 waves from 1366 at 1376. We believe this to be the third wave a 5 wave correction from 1365.

The remainder of the day was spent moving back down, working on wave 4 of that sequence. In this wave the market dropped to 1369 before moving slightly higher into the close.

It does not appear that we have quite completed wave 4, therefore we expect a slightly lower opening on Tuesday, looking for a wave 4 termination point between 1367 and 1369. From there we look for the market to move higher, as we have yet to complete wave 5 from the 1365 low. We would expect wave 5 to carry the market back to the 1378 level.

Longer term we believe we have completed waves 1 and 2 from the 1388 high, and waves 1 and 2 from 1422. We still anticipate the market moving lower, with our current target remaining at 1330. Should we move above the 1380 high, we would expect the market to continue higher, most likely moving above the 1388 high and completing another 5 wave sequence from the 1357 low. We don’t believe this would carry us above the 1422 high.

Sunday, April 15, 2012

Looking Ahead

On Friday the market completed a 5 wave sequence from the 1388 high. We are looking for a slightly higher opening for Monday, perhaps to the 1373 level. From there we would expect the market to move lower, below the 1369.85 low, and start a new sequence.

This sequence should see the SPX move down to 1358, rebound a point or two, and then continue down to 1348. This would fit nicely with the projection from the 1422, which calls for a move to 1343, followed by a rise to 1355, and a final low around 1330.

We do not see the move higher on Monday to be a tradable rally, but rather a point to take advantage of another move lower.

Will We See a Monday Bounce?

After Thursday’s close we stated that we had completed a 5 wave corrective sequence from the 1357 low, and that we were now expecting another move to the downside starting on Friday. The market did sell off at the open, quickly moving down to 1383. From the 1388.13 high on Thursday, wave 1 was the drop to 1387. The market then formed an inverted corrective wave that started on Thursday, and then carried over to Friday’s market. This inverted corrective wave ended at 1383, and from there the market moved lower once again. When the SPX hit 1380.12, a 5 wave sequence from the 1388 high was completed.

After a quick run up to 1383, the market turned lower again, breaking through the 1380 level and signaling another 5 wave sequence to the downside. The market finally found some support at 1373, and that marked the termination of wave 3 from the 1388 high. The market then spent the next several hours in a corrective sequence, finally topping out at 1379.

From there, the market moved lower once more, hitting 1375, finding some short term support, and then breaking through the previous low of 1373. The market continued lower into the close, hitting a low of 1369.85, before closing just above that level.

From the 1379 high, the market appears to have formed 4 waves, and is currently in the fifth. It is also just tenths of a point above a level that would complete a 5 wave sequence from 1388. We could see a small bounce on Monday, but we believe this would only be a temporary pause to the downside move. This would appear to be a wave 1 of another 5 wave sequence down from the 1422 high. We continue to believe that the market will work lower, to at least the low 1300’s.

Thursday, April 12, 2012

Thursday's Market

We were looking for a slightly lower opening on Thursday, with a price of 1365-1363 completing a 5 wave corrective sequence from Wednesday’s 1375 high. From there we expected a move higher, with a move above 1375 signaling another 5 wave sequence up.

The lower opening never materialized, with the market moving higher at the opening. The low of 1367 was slightly higher than expected, but appears to be the termination point of that corrective sequence. The market did break through 1375, and another sequence was underway. The market paused momentarily at 1378, completing Wave 3 from the 1357 low. The wave sequence from that point was a 5 wave inverted corrective Wave 4. A slight drop to 1376 was followed by another short term high at 1383, and then rose again to 1387, after falling to 1382. One final small dip to 1384 completed the Wave 4 inverted correction. From there the market completed a 5 wave sequence terminating at 1388.13, which also completed a 5 wave sequence from 1357.

This 1388 high took out the 1387 Wave 2 high, which means 1357 was the termination of a 5 wave sequence from 1422 as we discussed yesterday.

Having now completed a 5 wave corrective sequence from that 1357 low, we can now look for the market to move lower once again. We are still looking for this move from 1422 to carry us into the low 1300’s, and perhaps lower. 1388 is now the level we are watching that would indicate the market will still move higher.

Wednesday, April 11, 2012

Wednesday's Market

On Tuesday we said we did not think we had completed a 5 wave sequence from the 1357 low. We were looking for a continuation of that corrective sequence heading into Wednesday’s open, with a move to 1364-1365 completing that move.

Instead of the move terminating at 1365, the market headed straight up to 1373. From that low the SPX rose to 1361before turning back down. This would turn out to be a wave 1of a corrective wave sequence. The move back down to 1358 was then a wave 1 of an inverted corrective wave sequence from 1361 that would carry over to Wednesday’s trading session. The rise to 1362, and fall to 1369 on Tuesday became waves 2, and 3 of that sequence. The opening on Wednesday was wave 4, and this carried the market to the 1373 opening move. The short drop from there to 1370 completed the 5 wave inverted corrective wave sequence with a model value of .9997.

Having completed the corrective sequence, and thus wave 2 of the move from 1357, the market once again was poised to move higher. First it rose to 1373, fell back a point, and then made a final move to 1375. This completed a 5 wave sequence from 1357.

From 1375 the market began to erode, completing a 5 wave sequence at 1370 with a model value of .9934, and another 5 wave sequence from 1375, terminating at 1368.33. This sequence was 1375, 1370, 1372, 1369, 1370, and 1368. This sequence yielded a model value of .9963.

From 1368 the market tried to move higher once again, but completed a 5 wave sequence below the previous high, topping out at 1373.  From there it was mostly lower into the close, completing a 5 wave sequence from 1373 at 1367 in the last hour, and then moved slightly below that mark in the final few minutes.

We do not see the completion from the 1375 high; therefore we would look for the market to move lower, at least at the opening, on Thursday. The way the wave structure stands, a move down to 1365-1363 would complete that 5 wave sequence. From there we will be looking for a move above 1375, which would indicate the move up has further to go, or a break below the 1365-1363 low.

To recap, we believe wave 3 of a 5 wave sequence from 1422 was completed on Tuesday at 1357. The action since then would be wave 4 of that move, which may have terminated at 1375. A move above 1375 would mean the corrective sequence higher would continue, and we are looking for a short term low around 1365, and then a break of that to signal a continuation of the downtrend.

There is a count that would make the 1357 low the termination point of a 5 wave sequence from the 1422 high, which would possibly indicate that this move up could last a little longer. That count cannot be confirmed on the daily charts, se we’ll maintain our current count, but a move above 1387 would confirm 1357 as a wave 5 low. Keep in mind we still expect the move lower from 1422 to continue. We do not think we have seen an end to that move yet.

Tuesday, April 10, 2012

Tuesday's Market

Sorry I haven’t updated here for a couple of days, my paying job was interfering with my fun job.

As of our last update, we believed we had started a major corrective wave from the 1422 high. It appears that Monday’s steep drop following the disappointing jobs report last Friday completed a 5 wave sequence from that high. 1404.62, 1392.92, and 1378.24 would be lows of that sequence; with 1378 being hit in the first half hour of Monday’s trading session. From there the market moved higher during the day, reaching 1387 before heading lower into the close. The move to 1387 had stops at 1383, 1382, 1386, and 1384 before reaching 1387, which formed a 5 wave sequence, with a model value of .9919, and pointed to another move lower.

That move came Tuesday, with the market opening lower, and continuing lower throughout the day. From 1387, the SPX completed a 5 wave sequence down to 1375, and then rallied slightly to 1376. Another drop to 1366, an uptick to 1367, and a final drop to 1357.38 formed a 5 wave sequence from 1387 with a model value of .9947.

The market then moved higher into the close, but we don’t think we have quite formed a 5 wave sequence from 1357. Given the current data, a move higher to 1364-1365 would complete that sequence.

Tuesday’s move below 1378 now means the market needs to complete a 5 wave sequence from 1422. 1378 now becomes wave 1 on that sequence. The rebound to 1387 would either be wave 2, or wave 1 of an inverted corrective sequence from 1378. The wave action over the next couple of days should give us the answer. If this ends up being a simple 5 wave sequence, with wave 3 at 1357, and wave 4 at 1364-1365, we would anticipate wave 5 to carry down to 1348-1339. Should this be a more complicated wave structure, we could move even lower.

Thursday, April 5, 2012

Wednesday's Market

We were looking for a lower open, having closed on Tuesday at a wave 5 termination point, and we got one. The market gapped down at the open, and continued down in the first couple of minutes to the 1400 level, before finding some temporary support. After rising several points to 1403, the market moved to new lows for the day. At 1394 a 5 wave sequence from 1422 and a corrective sequence was in order.

The SPX completed the first wave of this sequence just shy of 1399, and then headed south once again. A new intra-day low at 1394.09 formed wave 2, the move to a new low indicating an inverted, or semi-inverted corrective wave was in progress. A bounce to 1398 and the subsequent drop to 1396 were waves 3 and four of the sequence. Rallying once again into the close, the market topped at 1401.39, then fading to close at 1398.96.

We believe the final rally was the fifth wave of the semi-inverted corrective sequence from the 1394.33 low. This would indicate another down move on Thursday, which would most likely be wave 3 of the move down from 1422. We are still anticipating a move below the 1391 level, which would confirm the current downtrend. Interestingly, the bottom of this move is almost identical to the bottoms at 1391, and 1387. In both cases we thought we had formed a semi-inverted corrective wave from those bottoms, and in both cases we were wrong. We believe we are correct in the current count, but given the circumstances will proceed with caution. A move above 1401 would mean the corrective wave has not yet been completed, but we still believe this to be a corrective wave.

Tuesday, April 3, 2012

Tuesday's Market

After hitting a high if 1422.38 Monday afternoon, the market pulled back towards the close. Monday’s action from that high turned out to be wave 1 at 1417.43, and wave 2 at 1419.18. Tuesday’s open was a continuation of that sequence, with the market dropping to 1414.98 before a slight rally back up to 1418.34. Again the market fell, this time reaching 1414.18. This completed a 5 wave sequence from the 1422.38 high with a model value of .9983.

From there the market tried to rally, hitting 1418.74 before turning down once again. When the market fell through the 1414 level, a new 5 wave sequence to the downside was confirmed. This time the market hit 1410.27 before finding some support. A short-lived rally ensued, pushing the market back to 1414.13 before dropping once more, this time to the day’s low of 1404.62. This completed Wave 5, giving a model value of .9986.

From this point the market moved higher into the close, completing a 5 wave sequence at with stops at 1406, 1405, 1408, 1407, and finally at 1411.13. This sequence yielded a model value of .9950.  A pullback to 1407.71 formed the second wave of another sequence higher, confirmed when the market moved above the previous high of 1411.13, reaching 1412 and a fraction. A very slight pullback below 1412 and one final move up to 1413.38 completed this sequence, this time with a model value of .9997.

Having completed a 5 wave sequence from the low of 1404.62 could make this a wave 2 of another sequence lower from the 1422.38 high. A move above 1413 would mean a move to higher levels.

1404.62 is the first level to watch for another possible move to lower levels. The next level to watch would be the 1392 low. A move below that could signal we have finally broken out of this topping formation.

If we move above 1413, the next level to watch is of course the 1422 high. Should we break convincingly above that level, it could mean a breakout to the upside. At this point we still believe the odds favor a move lower from here.


Monday's Market

On Friday the market was up, completing a 5 wave sequence from the 1392 low late in the day at 1411, and then fading into the close. We said a 5 wave sequence down from that high had not been completed, and we expected the market to move lower at the open on Monday. From there we were watching for a break above 1411 as a signal of another 5 wave sequence higher. The market did open lower today, hitting 1404.46, and completing the 5 wave sequence from 1411. From there the market moved higher, breaking above 1411, and continuing up from there. A 5 wave sequence from 1392 was completed at 1420 and continuing higher still, completing another 5 wave sequence at 1422.38, the high of the day. From there the market fell to 1417, before rising and closing at 1419.04

While the market broke into new higher ground, our feeling that we are still experiencing a market top remains intact. We are still within our target range of 1378-1422 for that top, and the market has not been convincing in moving higher since it hit 1378.We are now, however at the top of that range, and a break above the 1422 would most likely signal a move higher from here. At the moment we will stand by our call of a market top, and look for a move lower from these levels.


Sunday, April 1, 2012

Last Week's Market

On Thursday the SPX completed Wave 5 of a move from the 1392 low, and then moved above it, indicating another 5 wave sequence up. On Friday that analysis was confirmed with a strong opening. When the SPX hit 1409, it completed Wave 3. From there the market turned down, spent the next hour working on Wave 4, which terminated at 1401. From there the market turned higher once again, spending most of the remainder of the day forming a detailed Wave 5. This wave made stops at 1409, 1407, 1410, 1409, and finally at 1410.89, which completed that wave. The market then turned lower into the close, hitting a low of 1406.86, before moving up slightly to close at 1408.47.

We do not discern a 5 wave sequence from the 1410.89 high, therefore we would expect the market to open lower on Monday. From there will be watching that 1411 level, a  move above that signaling another 5 wave sequence to the upside would be in order. Our belief at the moment is that 1410.89 is the high of a correction from the 1392 low. We now expect the market to work its way lower, now in a wave 3 from the 1419 high. That would be confirmed with a move below the 1387 low.

Longer term we still view 1419 as the high from 667. We are looking for a major 5 wave sequence to form from there.